Y’all know that I love teaching math. I don’t think that is a secret around here anymore. When I started teaching second grade over 8 years ago, I knew I had to up the engagement during our math block. Students felt defeated by the more difficult concepts and I was stumped when it came to getting through to them. I decided quickly that I needed to incorporate a more hands-on learning approach. We had done engaging activities before, but we weren’t doing them daily. Why only have fun during math once a week when you can have fun every single day?! My only regret is that I wish I would have started this thought process when I was teaching first grade for three years prior to teaching second. I was a new teacher and hadn’t learned a lot about student engagement. I had a great support system in my team, but I hadn’t found my own way just yet. We were having A LOT of fun in first grade, but our engagement wasn’t mixed with rigor. Now that Hope and I have developed 1st Grade Math curriculum, I feel like I’m getting a do-over. We take the standards and apply them to activities that are equally engaging and rigorous! Let me show you a bit what I’m talking about!
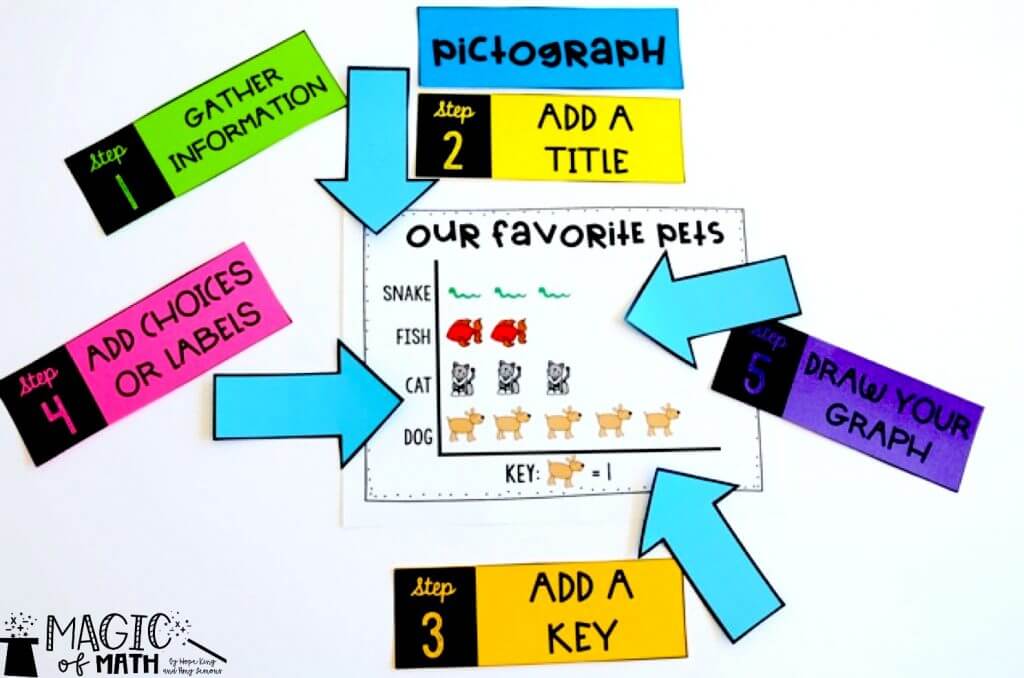
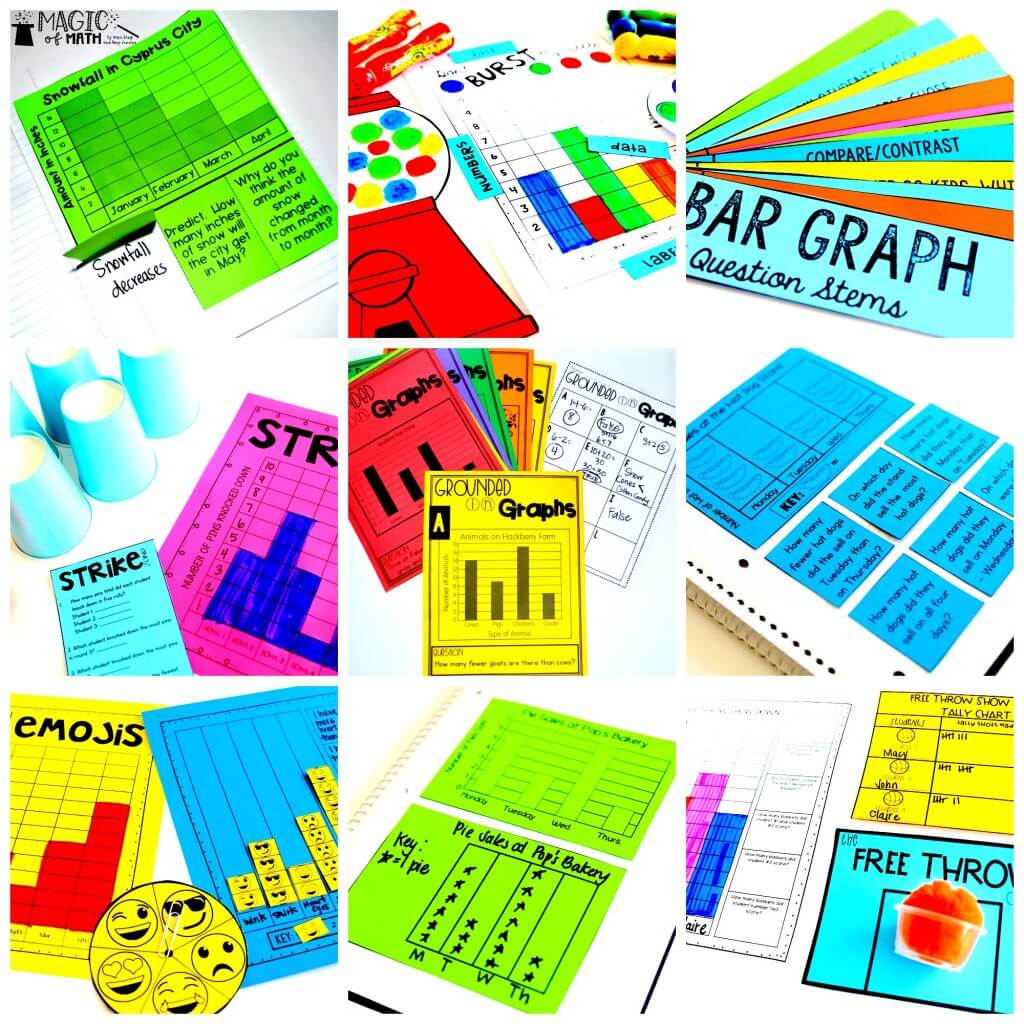
When we introduce a new type of graph, we start with paying attention to all the details! So often we have students complete graph after graph, but they don’t understand the how or why behind it. With each type of graph we introduce: pictographs, bar graphs, and tally charts, we made examples with steps and labels as well as question stems that teachers can use throughout their unit. These things help anchor the minilessons and whole group activities.
Of course we are going to have some fun while graphing! During Add Some Sprinkles, students spin a sprinkle color and create their ice cream. After the data is collected, students answer questions about their ice cream creation!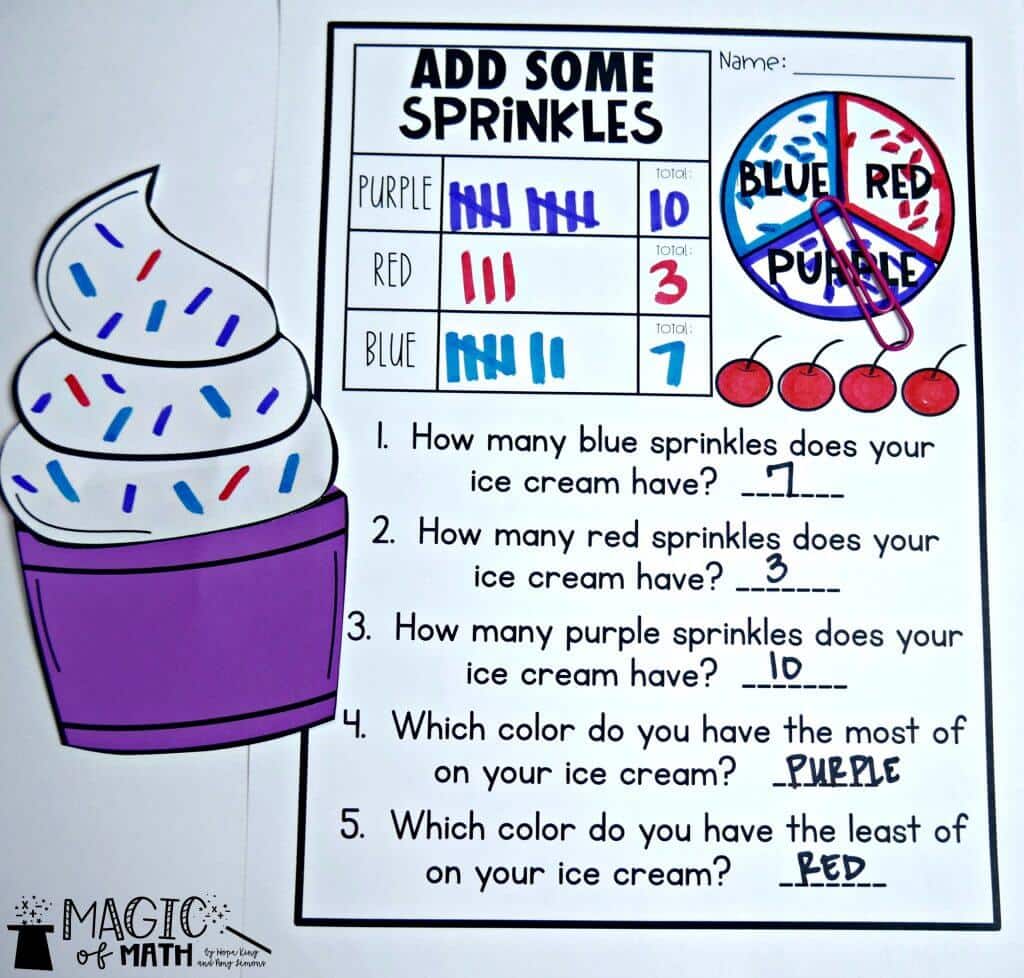
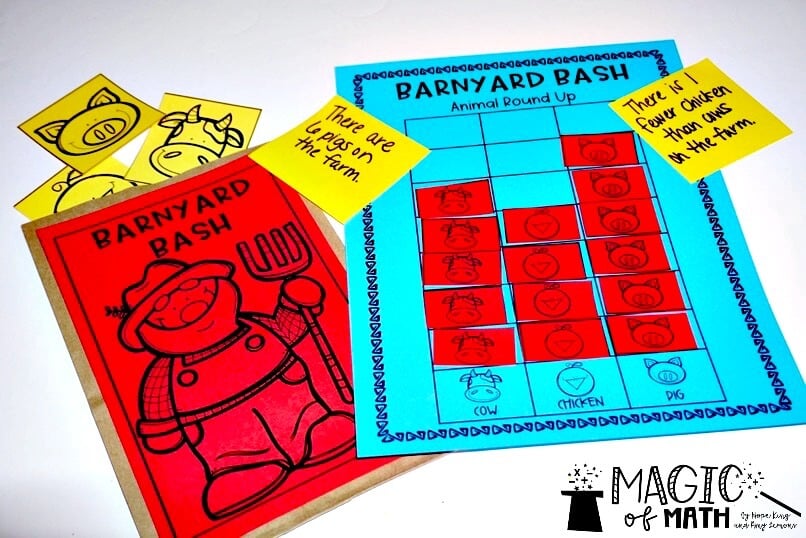
We don’t want students just creating their graphs. We also want them to be analyzing their data. For Barnyard Bash, students round up their animals by drawing farm animals from a bag. Then students will generate statements about their Animal Round-Up data!
There are so many ways to incorporate those interactive notebooks when it comes to graphing. Here are a few examples of how students can complete that independent work, but not be bored while doing so!
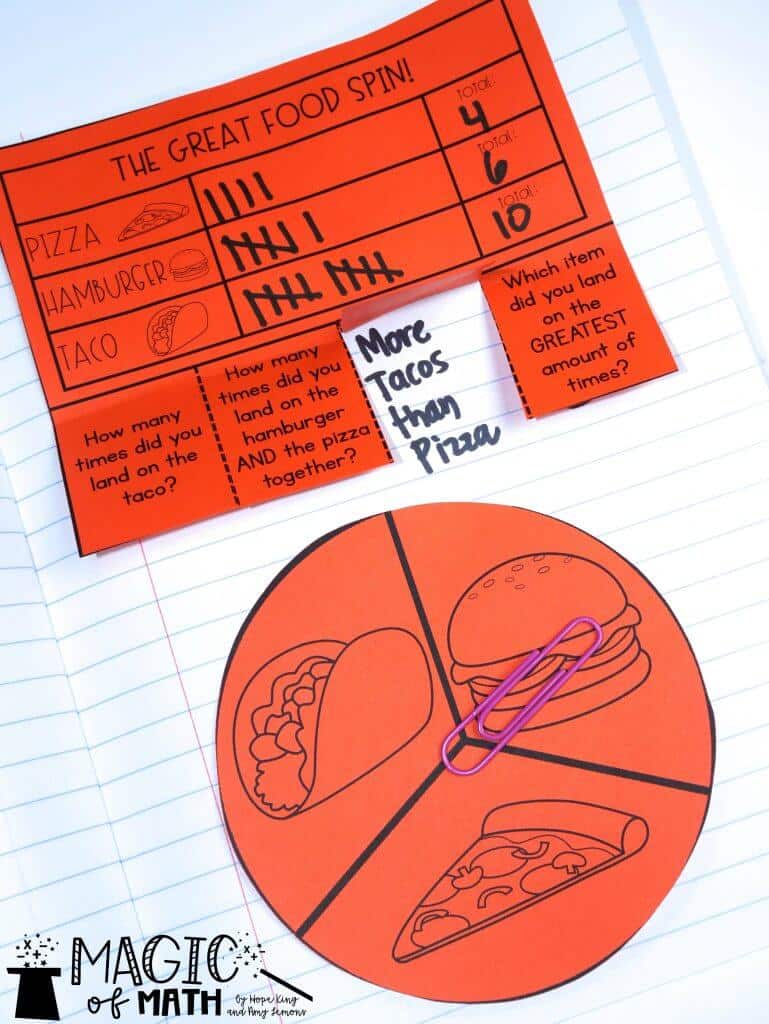
For this activity, students spin to collect their data, then they answer questions about the tally chart!
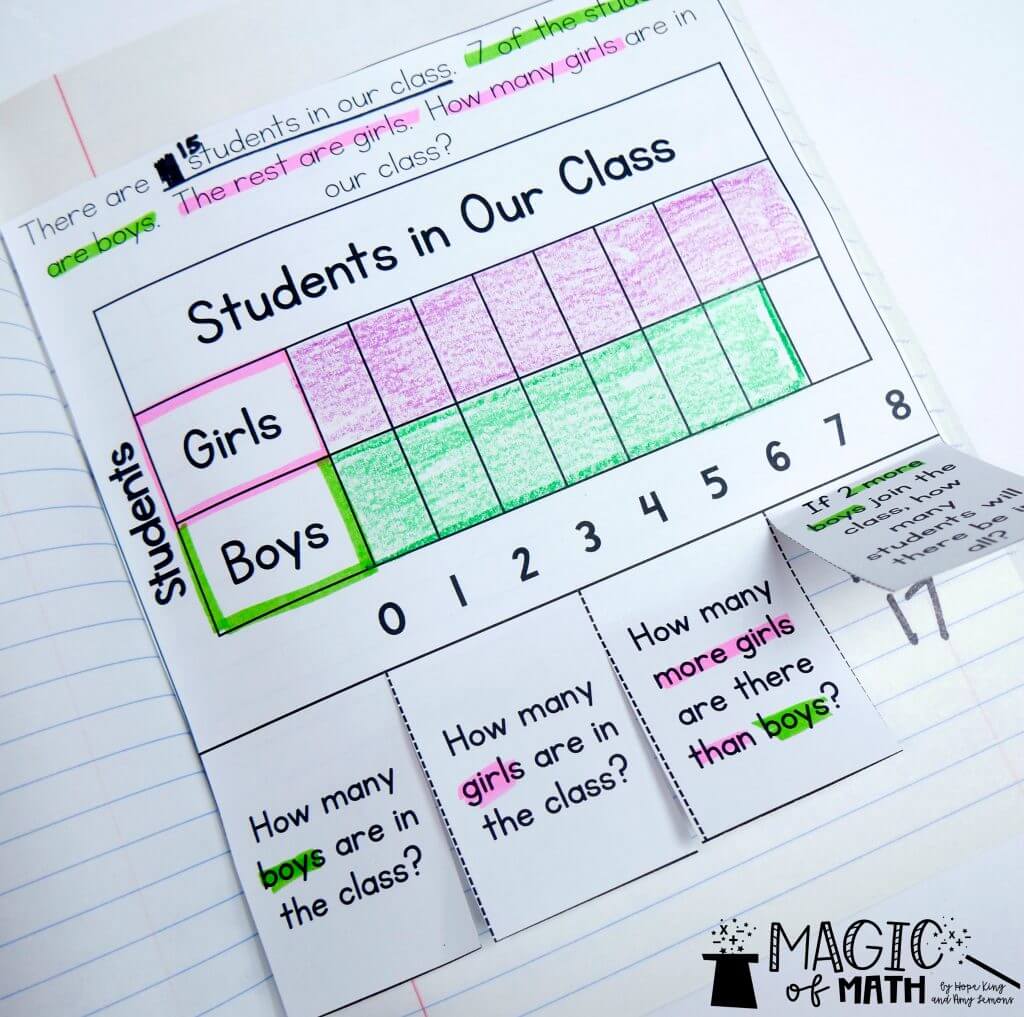
Pardon my error on the picture below, but you can see how in this graph students are using the information collected in a word problem to create a graph. The data in their graph directly correlates to solving the word problem! Integrating word problems with graphing takes the thinking to a whole new level!
We also teach students how to get their “Graph Talk” on. Students collect their data and then think to themselves, “What can I learn from looking at my data?” “What does my graph show me?”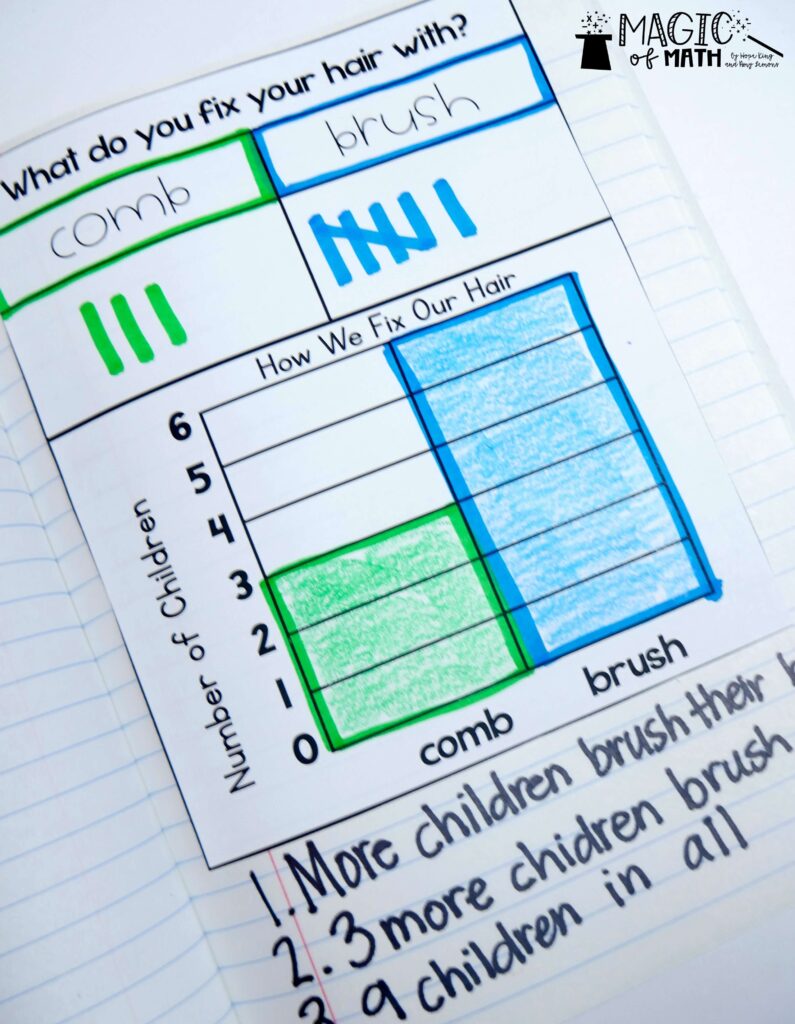
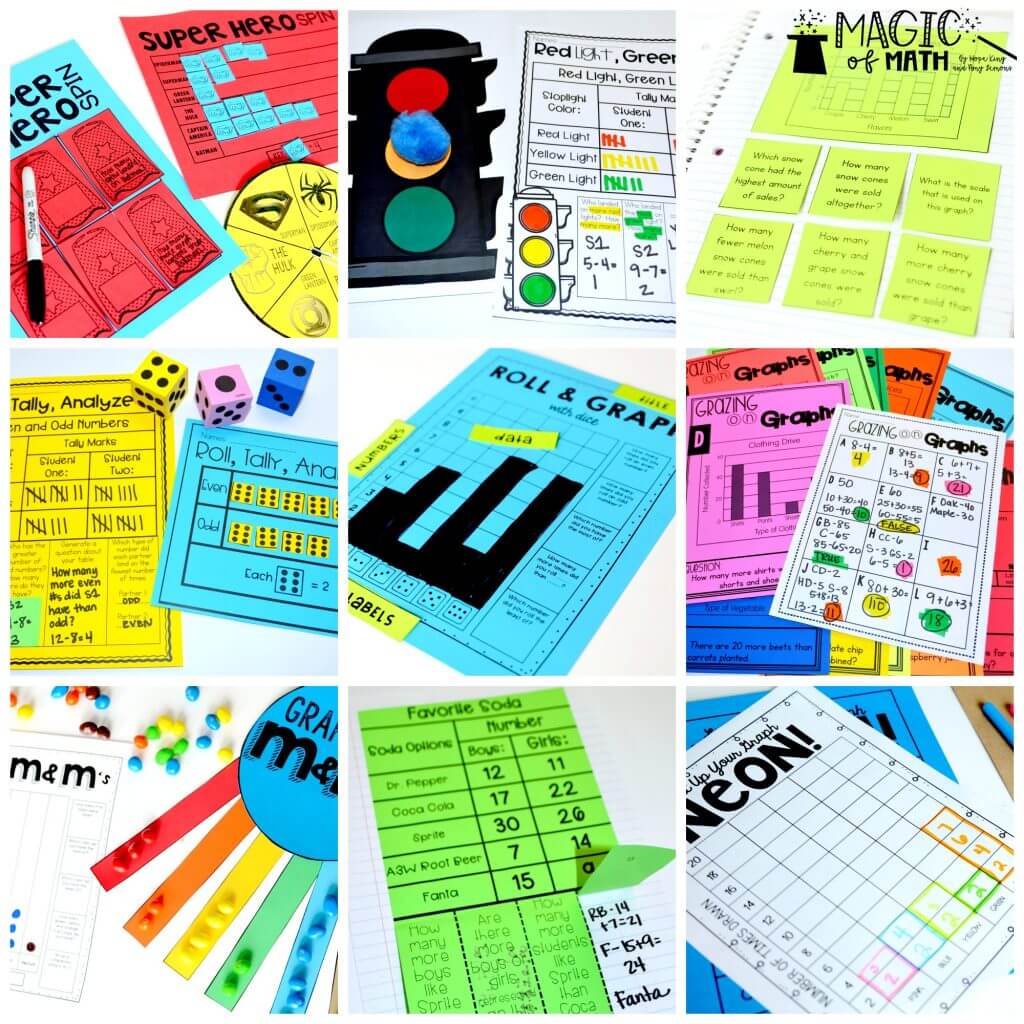
Let’s take a look at a few more of my favorite first grade graphing activities!
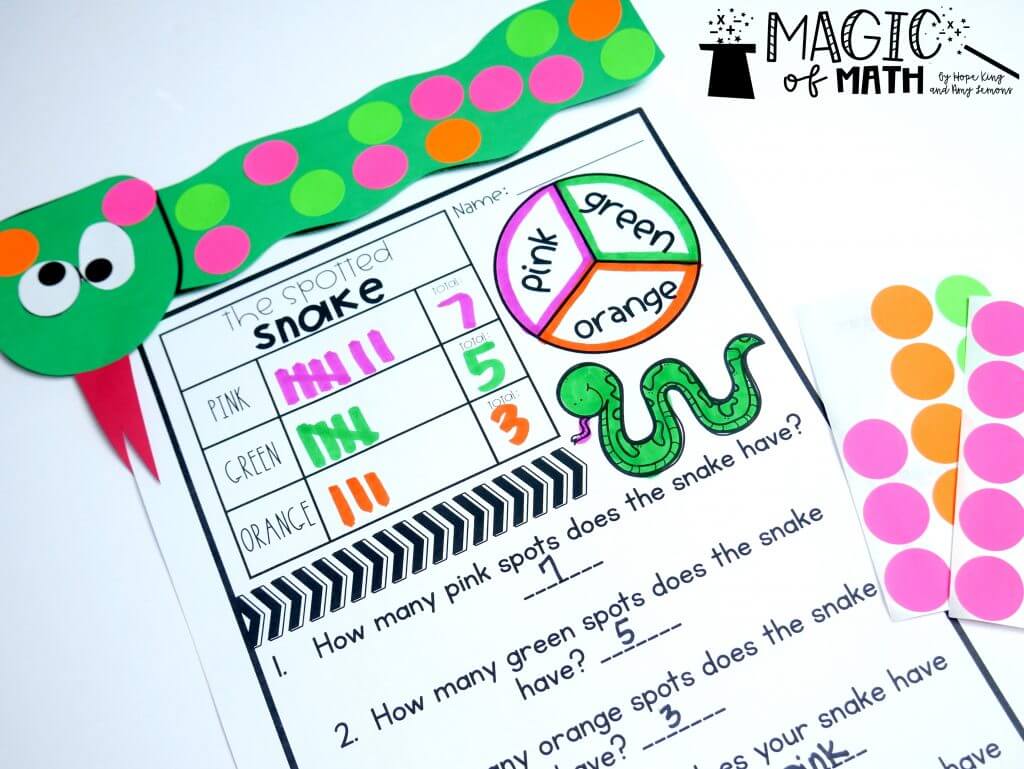
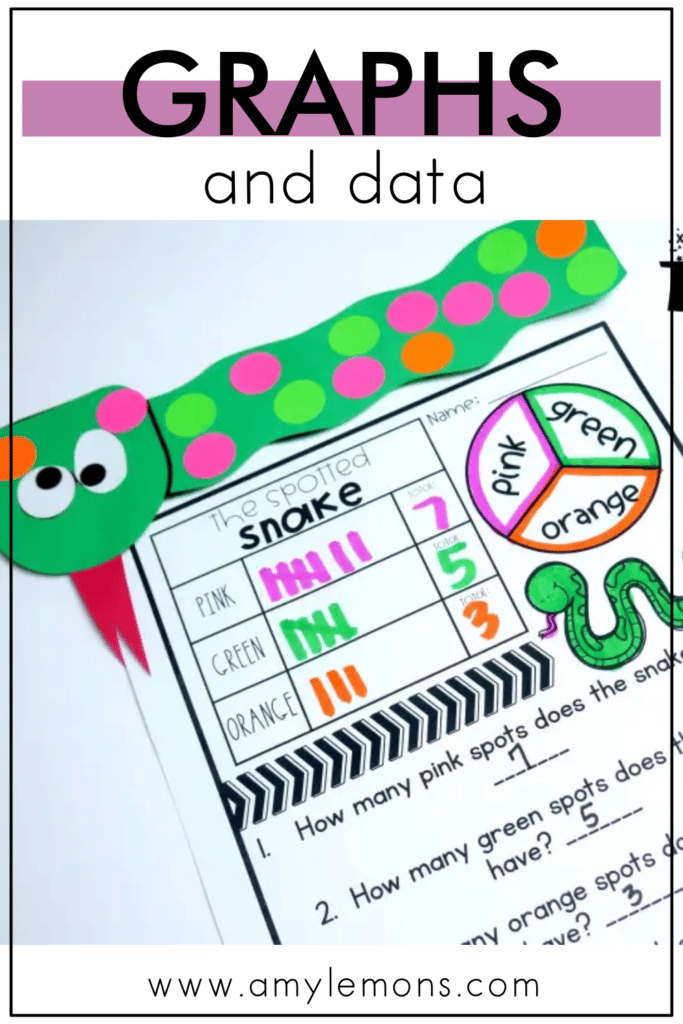
The Spotted Snake is a student favorite. Students use garage sale dots (or markers) to add spots to their snake. Then they will analyze the data!
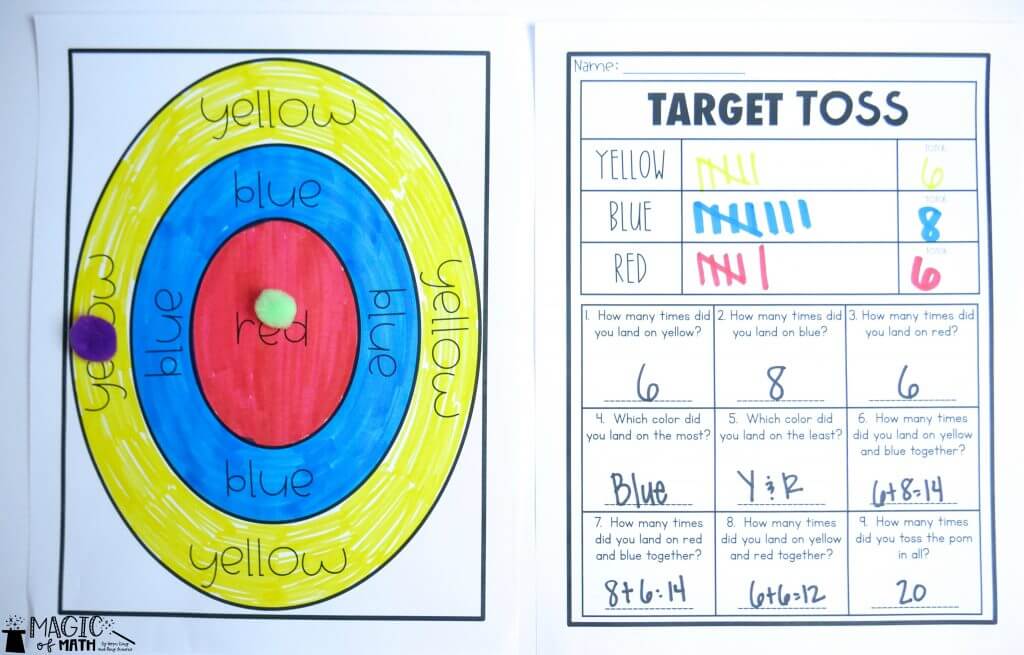
Who says you can’t play games while graphing??? During Target Toss, students toss their poms onto their target. As they toss, they collect data about the colors they landed on.
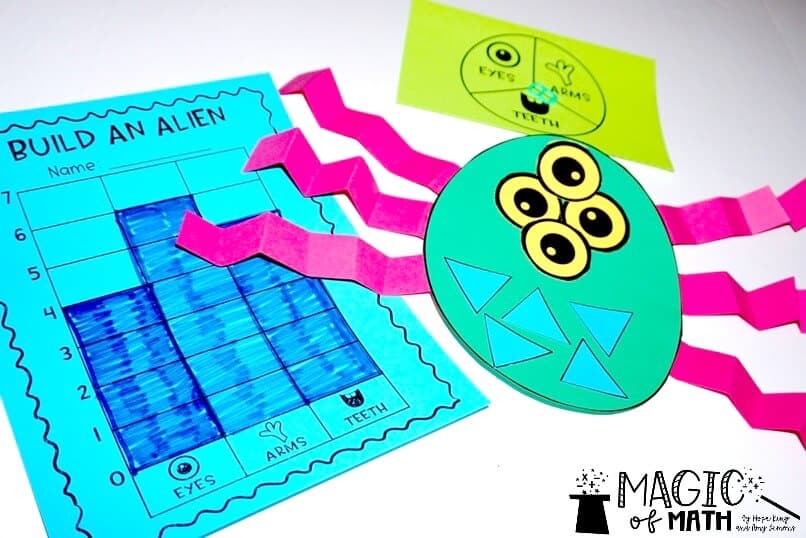
What first grader doesn’t love aliens? Students build their own alien by spinning to see which body part they need to collect. As students are building their alien, they show their data on a bar graph!
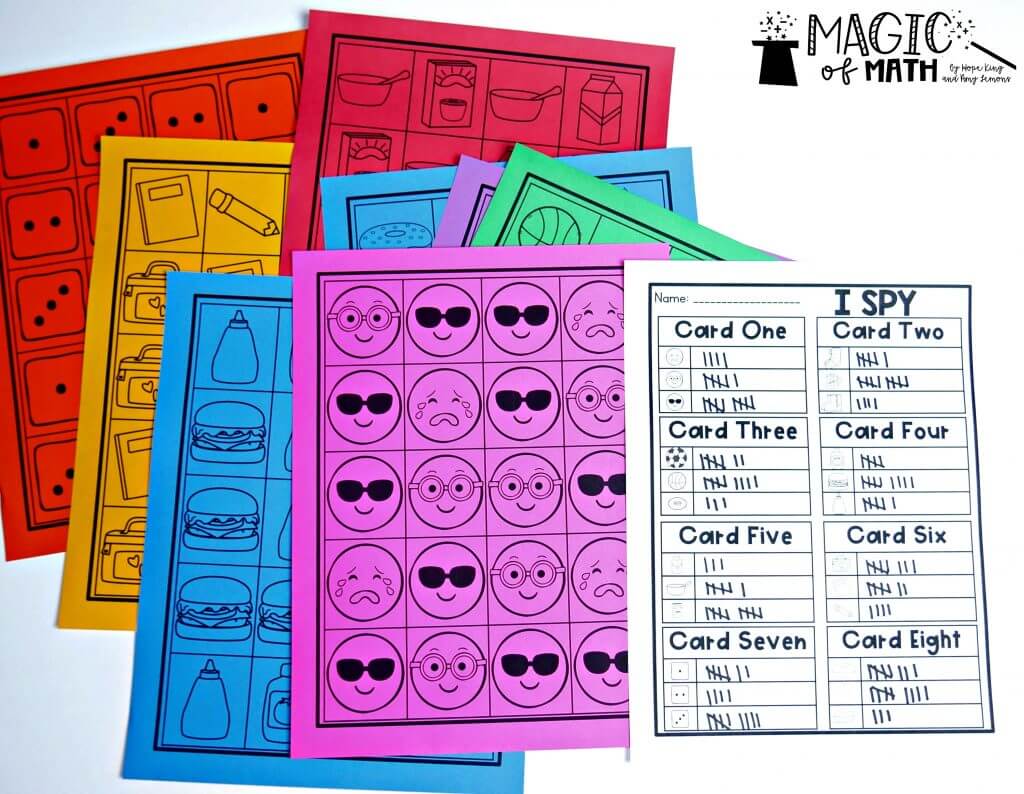
Students always enjoy a game of I Spy. Teachers place these I Spy cards around the room. Students visit each card and tally the objects seen on their tally charts!
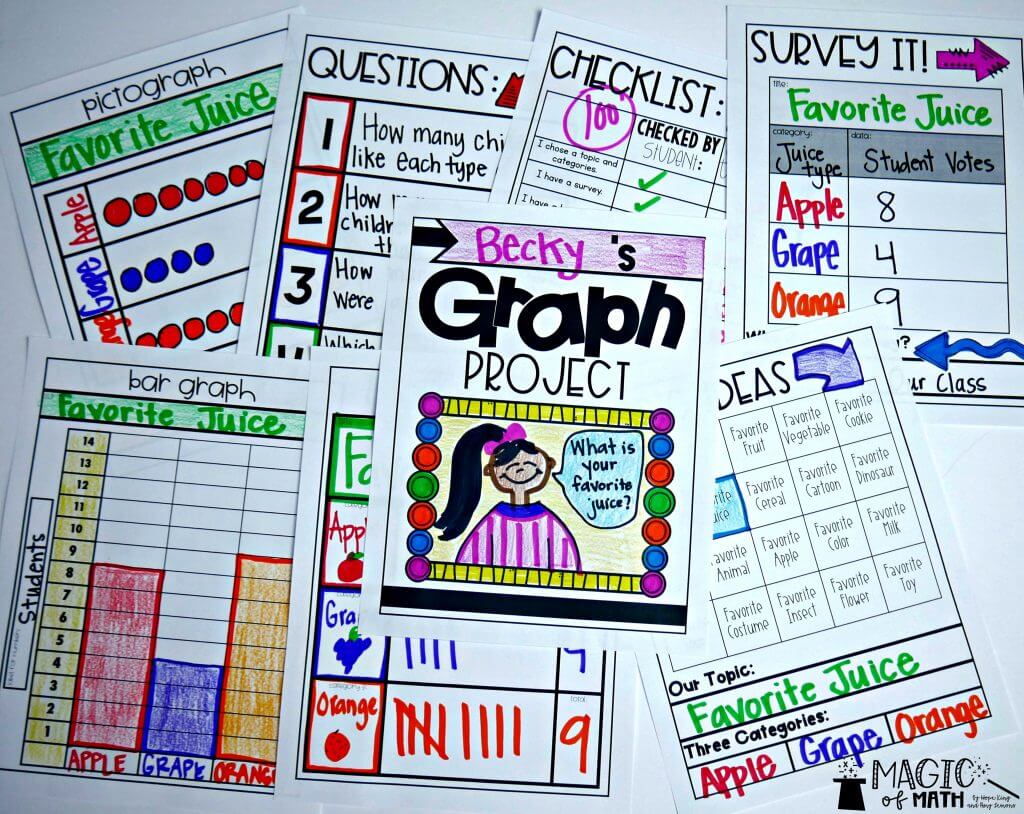
Our final project in this unit is taking all of the graphing knowledge they have obtained and completing their very own Graph Project. Students work in groups to select their graphing topic, complete a survey, collect data, and create graphs. During Week 4, students focus on one task a day so that they complete the entire graphing process!
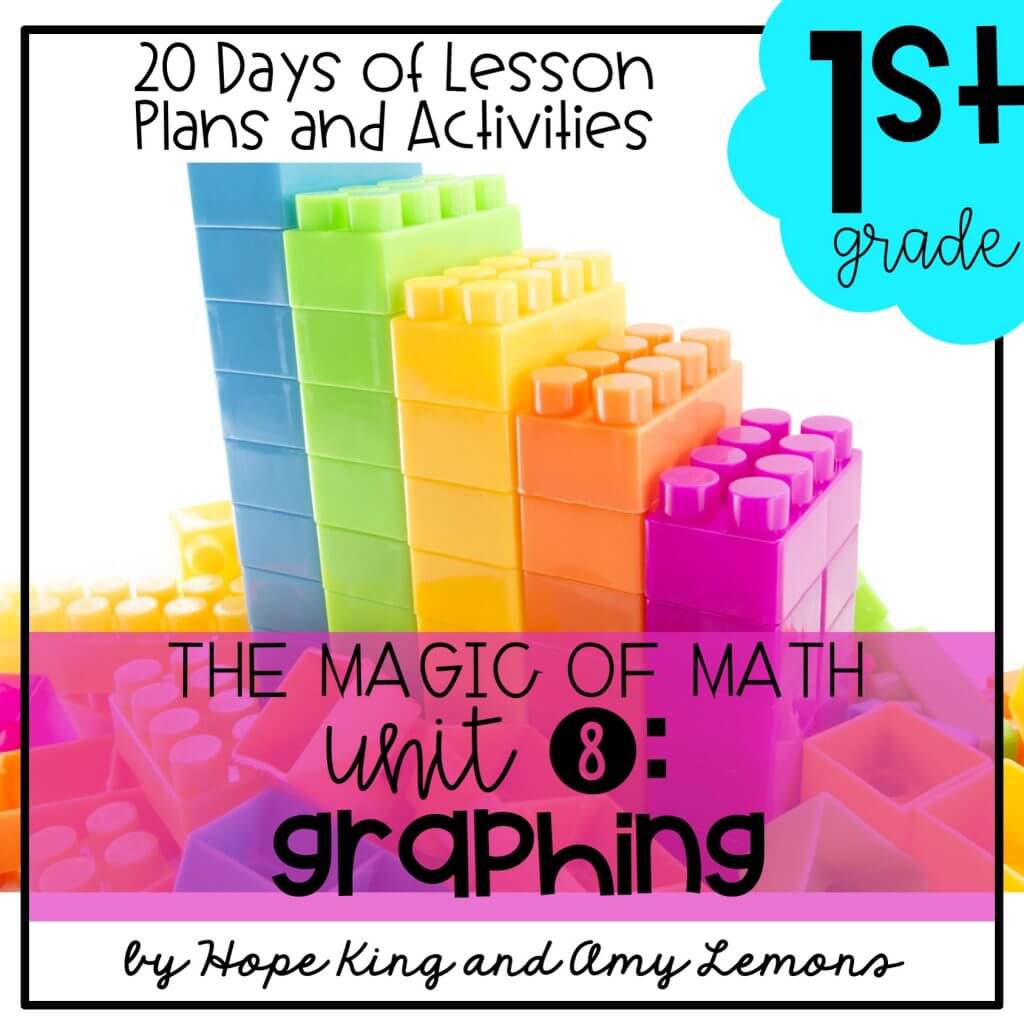
I’ve only shown you just a handful of the activities that we created. We’ve got 4 weeks worth of Graphing Goodness in our unit that you can check out below!
Don’t teach 1st Grade? That’s okay! We have equally engaging graphing ideas for…
AND Third Grade:
You can also click on the links below to take you to past blog posts about graphing. You’ll even find some freebies throughout!


3 Responses
Dear Amy,
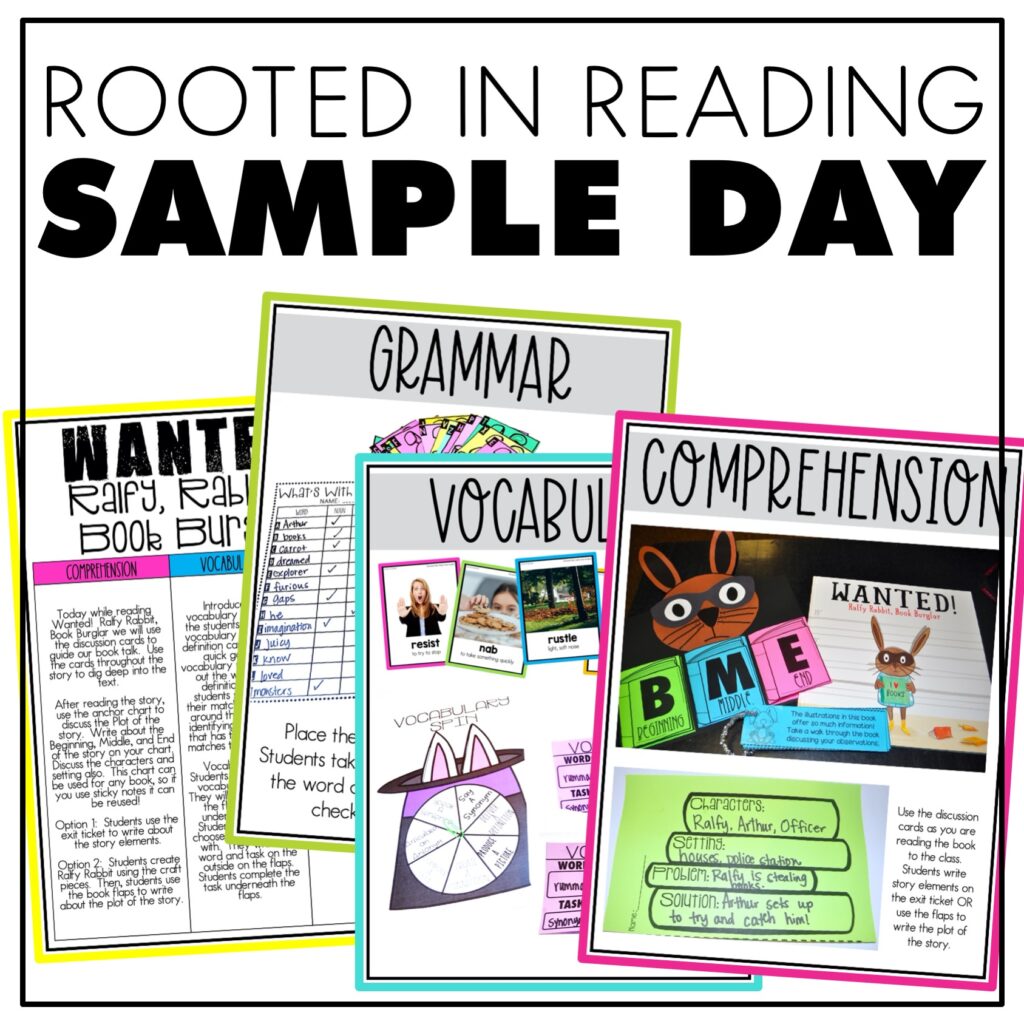
Would you and Hope ever create a Rooted in Reading for first grade because I absolutely love your tools, but teaching in a Title 1 school, the Rooted in Reading for second grade is way too difficult for my babies. Thank you greatly!
Warmly,
Stephanie Bruce
Katie and I will be releasing a first grade unit in April
I have taught 5th grade math for 4 years and just moved down to 2nd grade. I liked looking through your tools, they look like it’s something that will really help me this year.