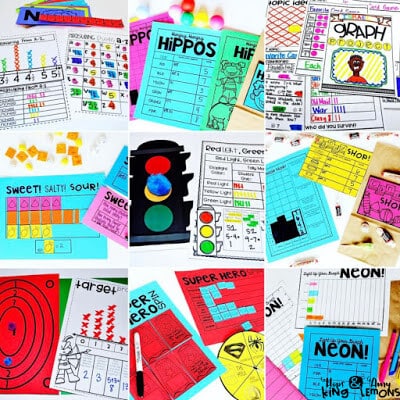
A couple of years ago I got stuck in a rut when it came to our graphing unit in 2nd grade. I mean, how much could one do with creating and analyzing graphs?! I wish I knew then what I know now… that graphing can really be so much fun! AND the students are capable of doing a lot when it comes to interpreting. Often times we limit them with the way we present a skill or how we question. What I’ve learned is that graphing really encompasses a lot of those skills we’ve been working on all year. We add, subtract, compare, order, and so much more when we graph. We can make predictions and draw conclusions. We can notice patterns and trends. Seriously, so much to learn!
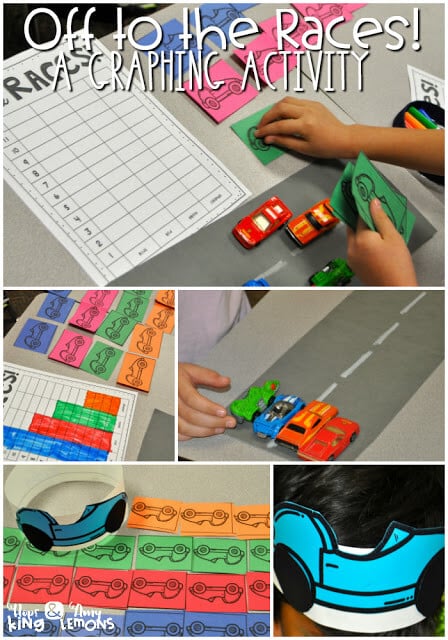
This week the students are working on creating pictographs. Today we were Off to the Races! Here’s what we did:
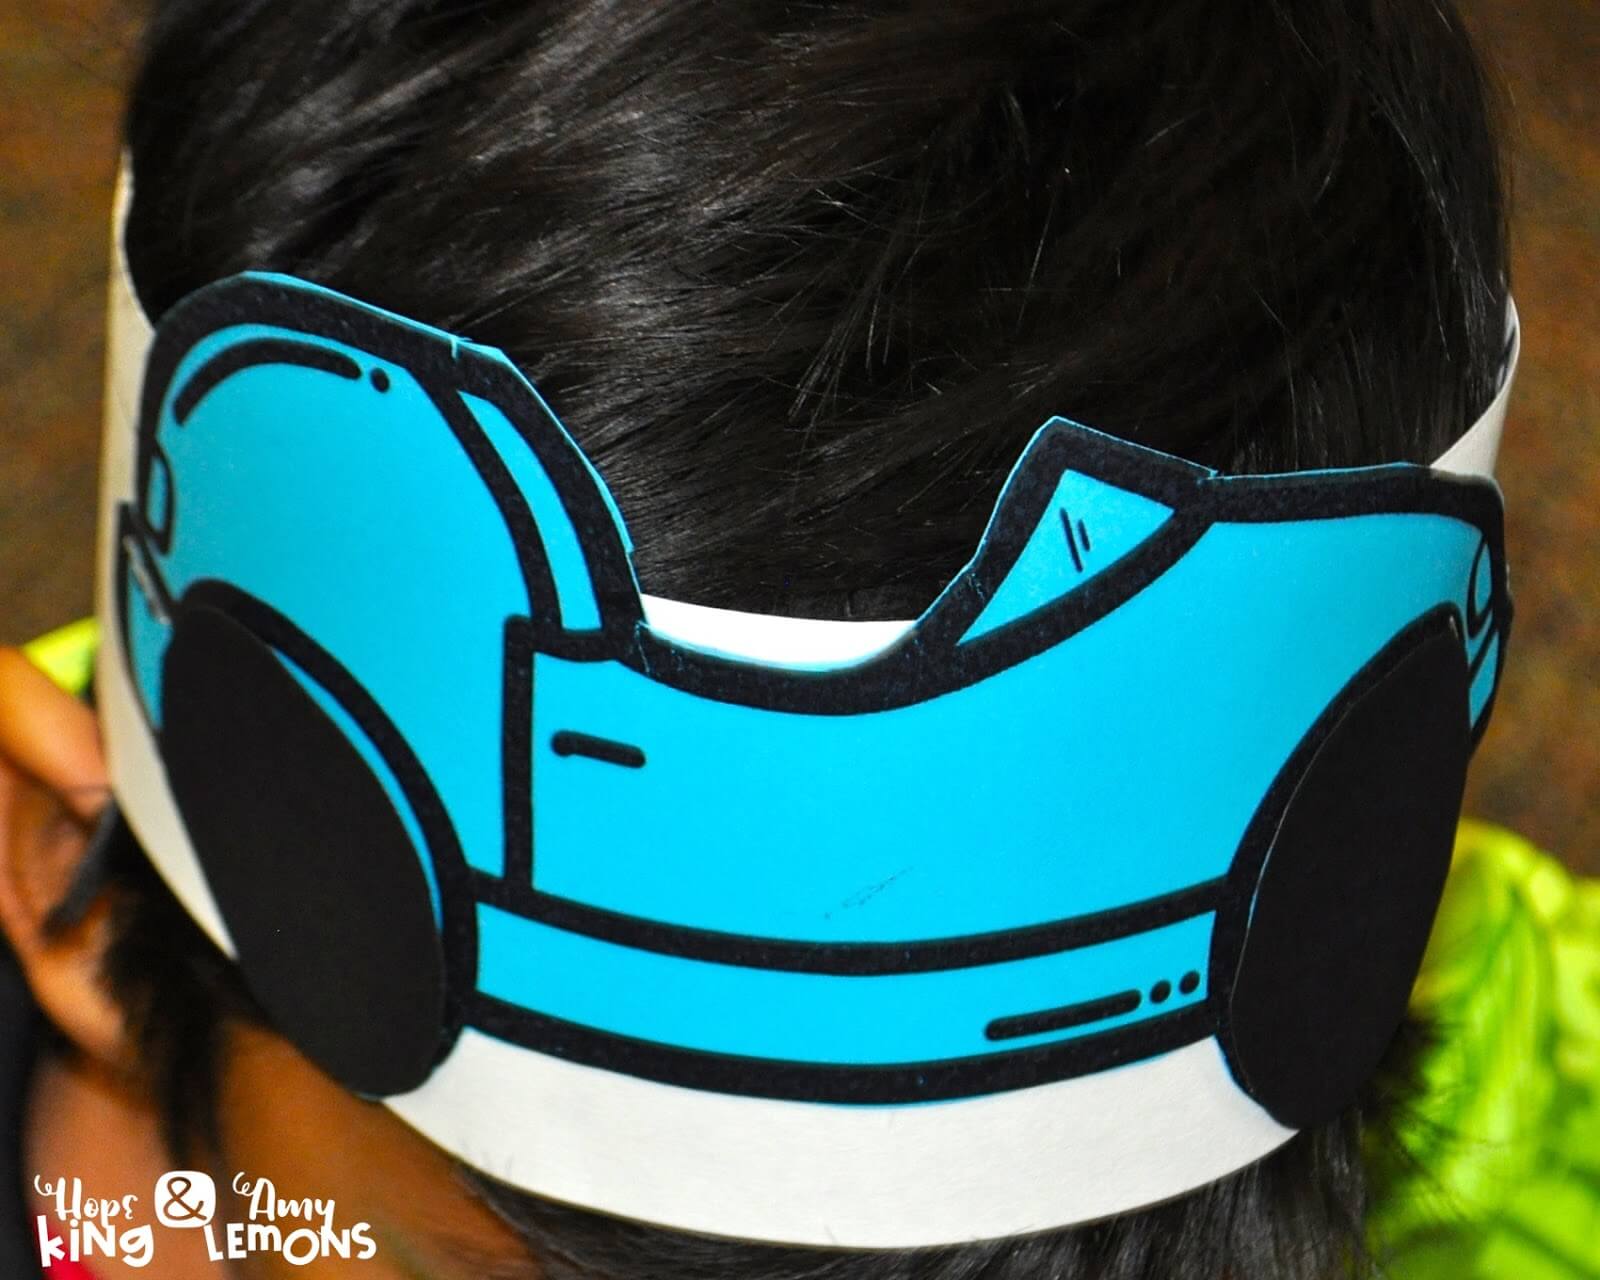
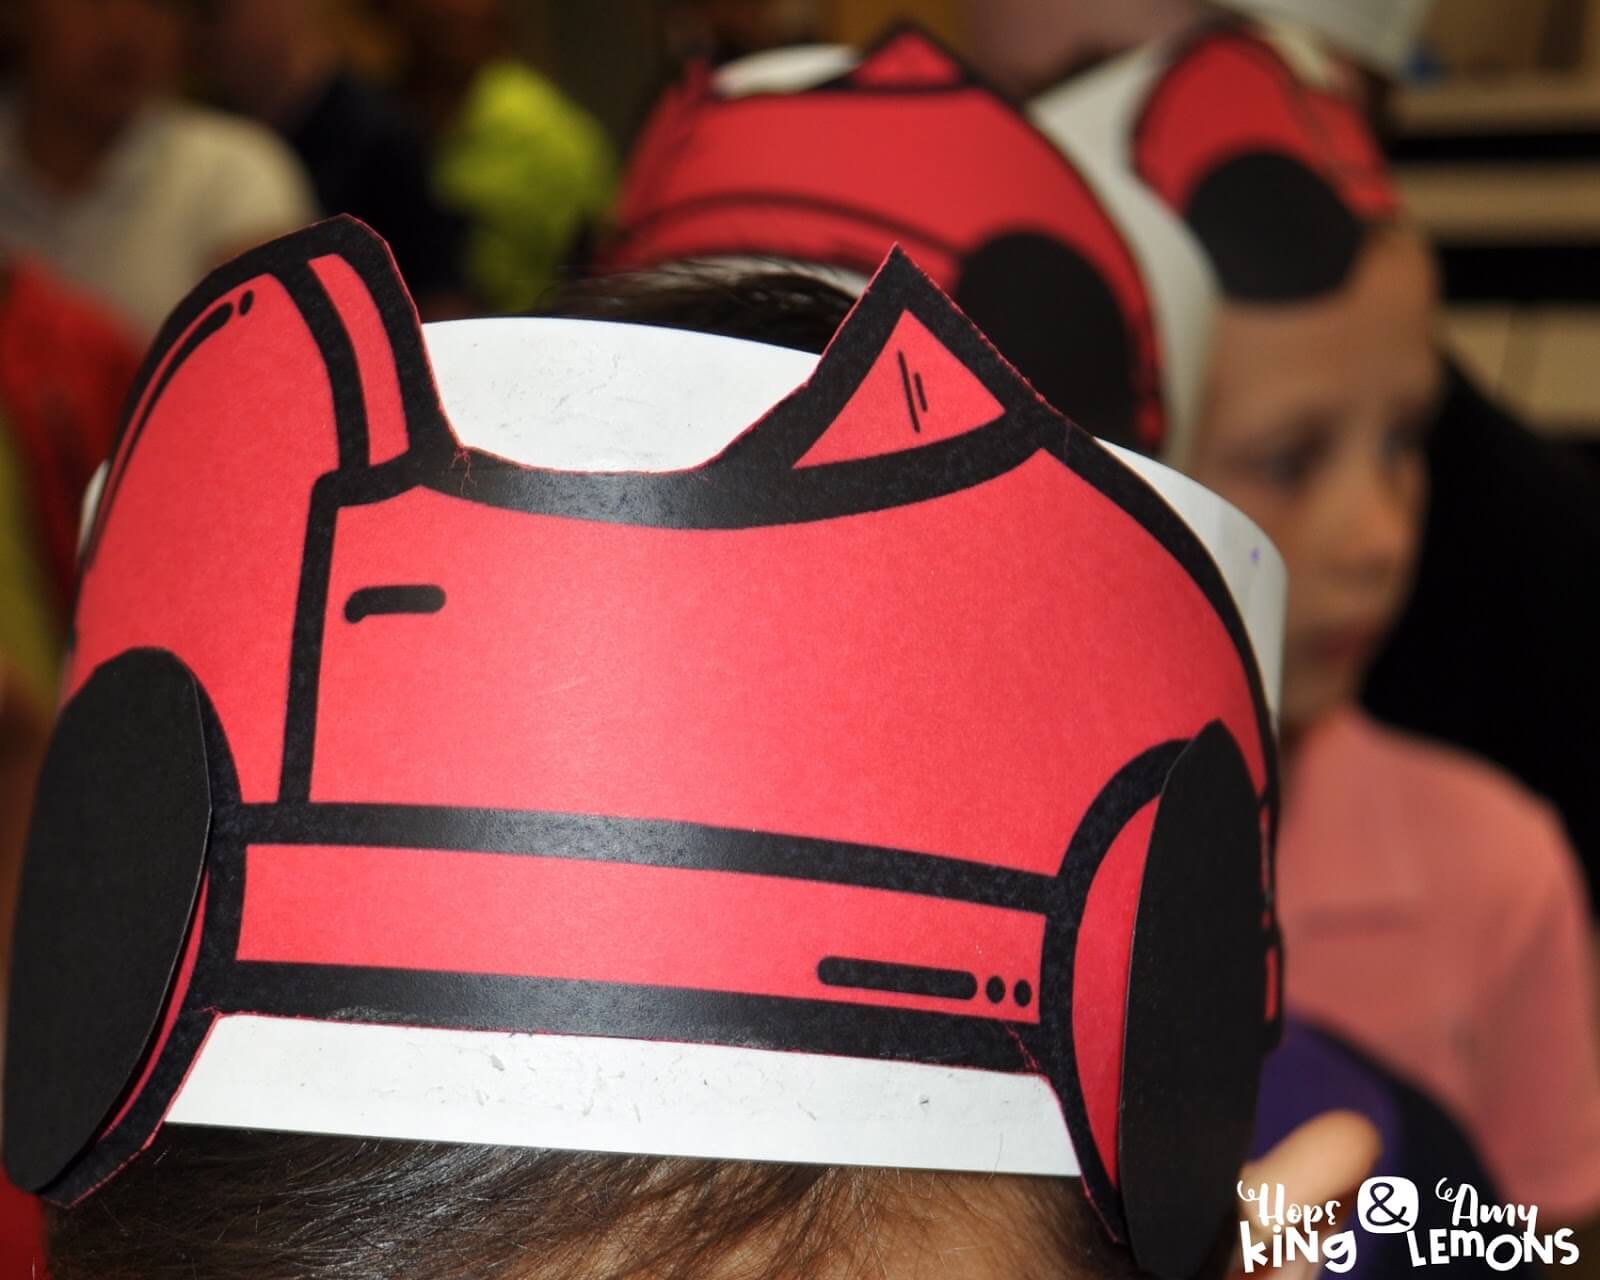
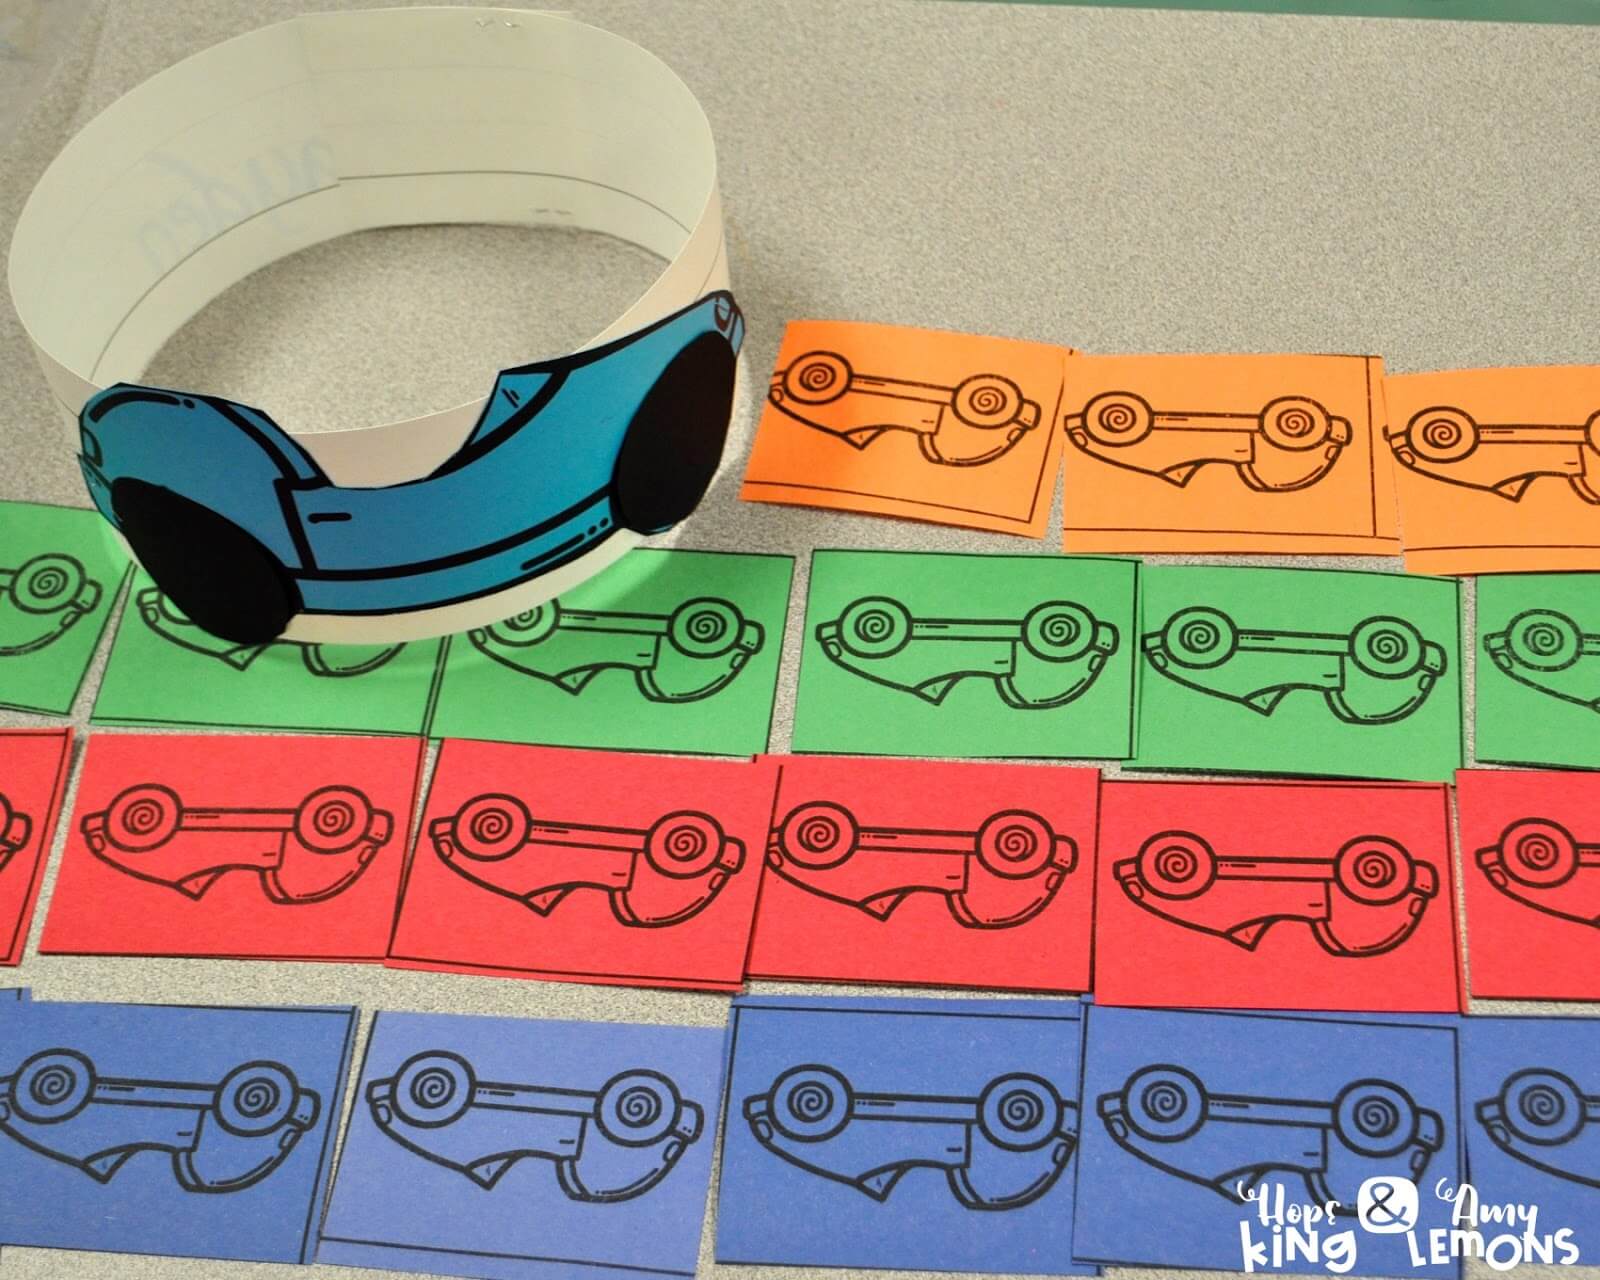
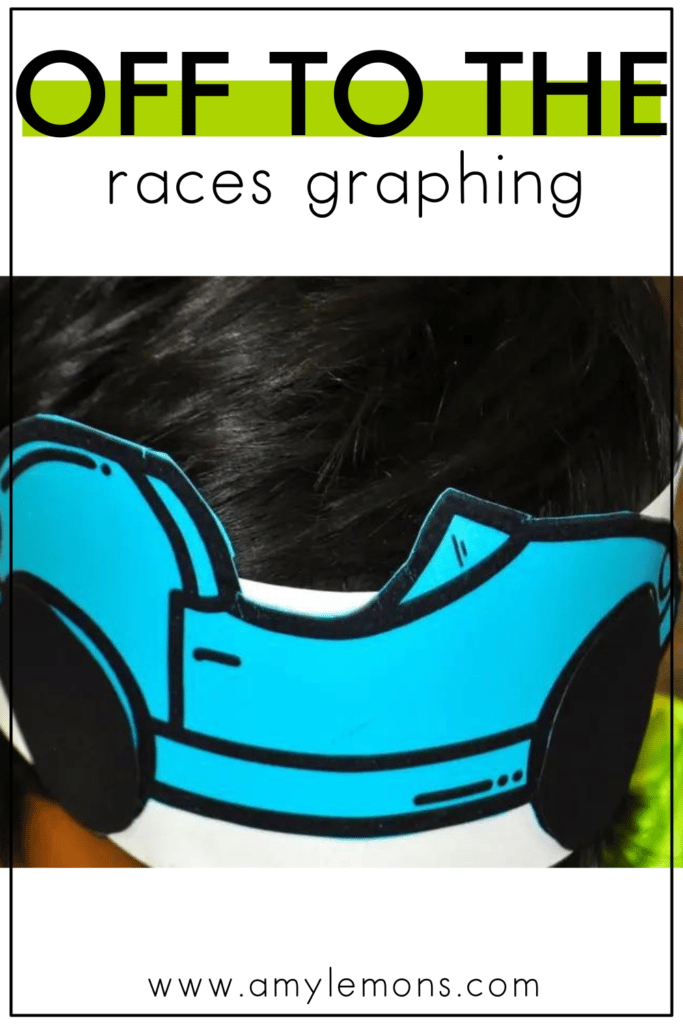
First, I told students that they had to make a prediction. Which car would win the race? They chose a color and made a quick headband to represent their predictions. I simply used clipart from Teaching in the Tongass to create the hats.
Based on our predictions, we made a class graph. The students had to determine how we would collect and gather the data. They decided to get into groups based on color. Then we made a human bar graph. We lined up and organized ourselves. Afterwards we discussed what we could learn from the graph that we made! This all took very little time- maybe 10-15 minutes tops with the hat making.
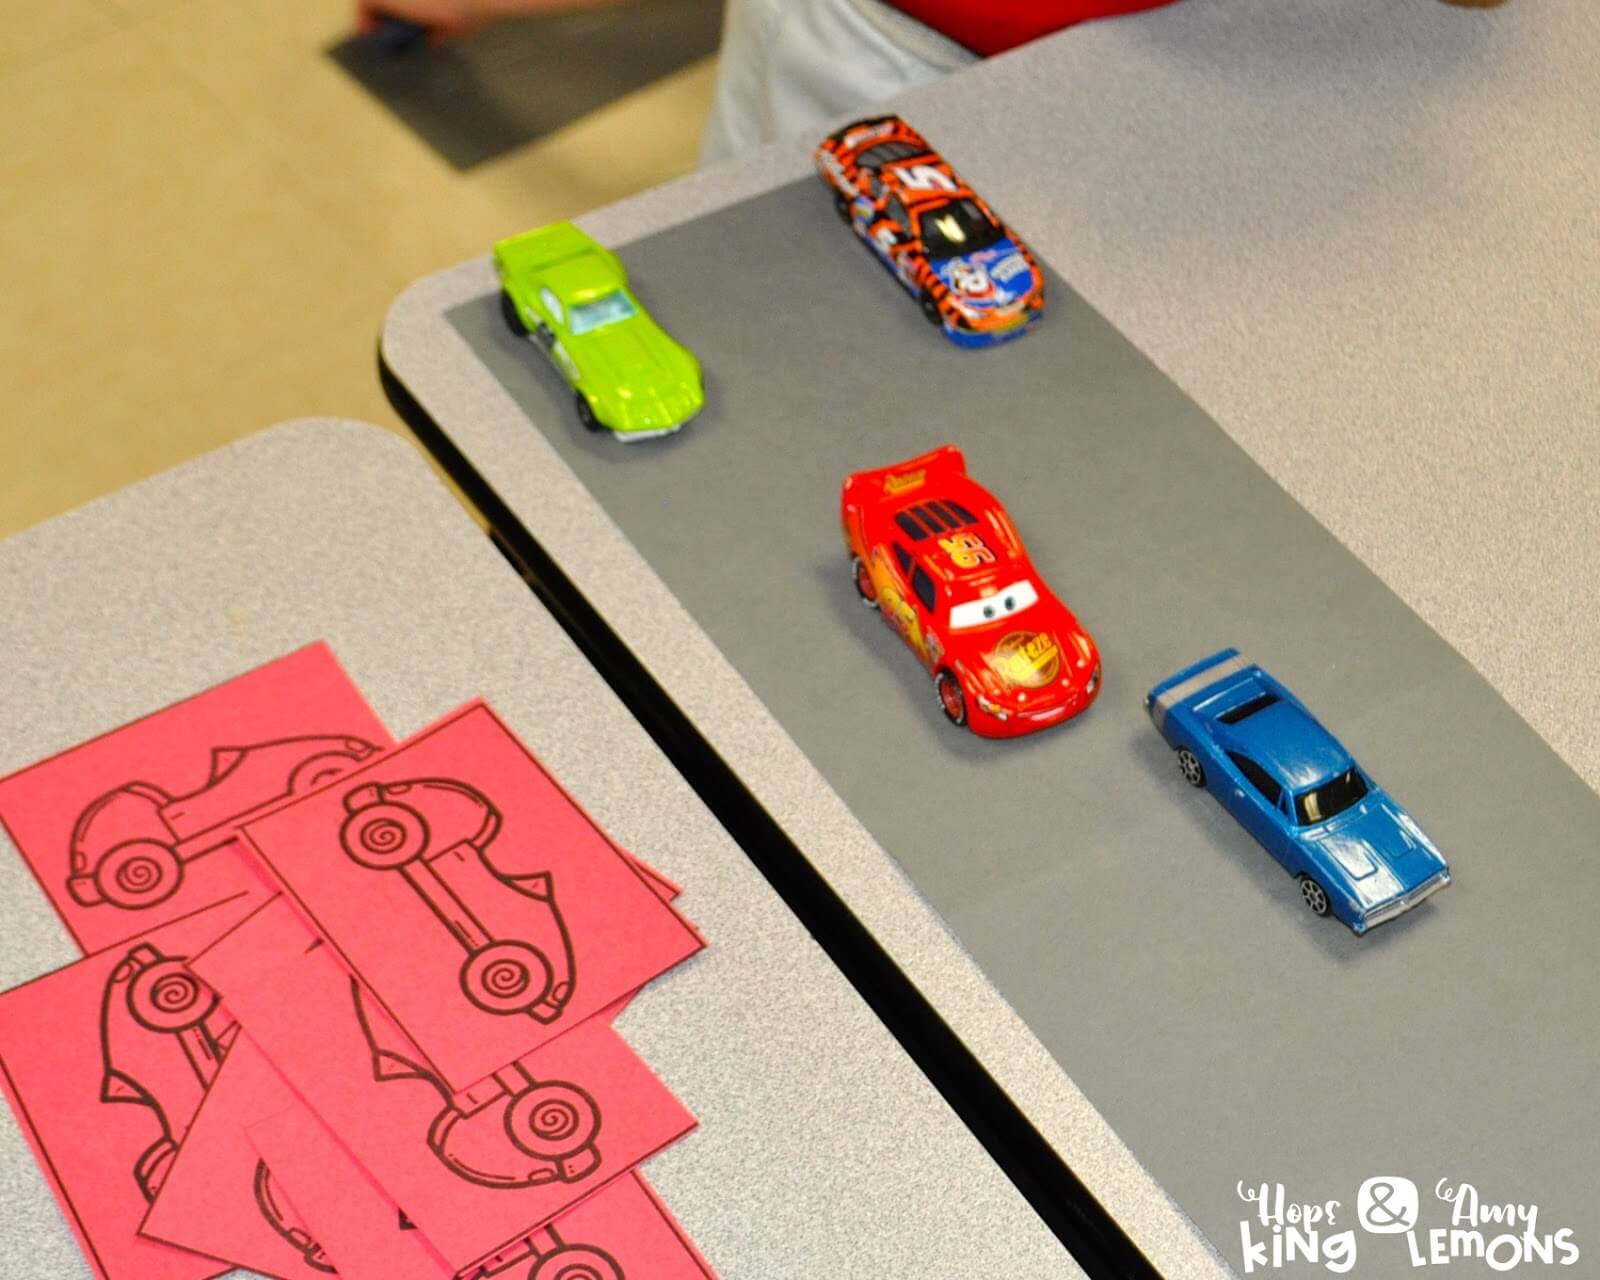
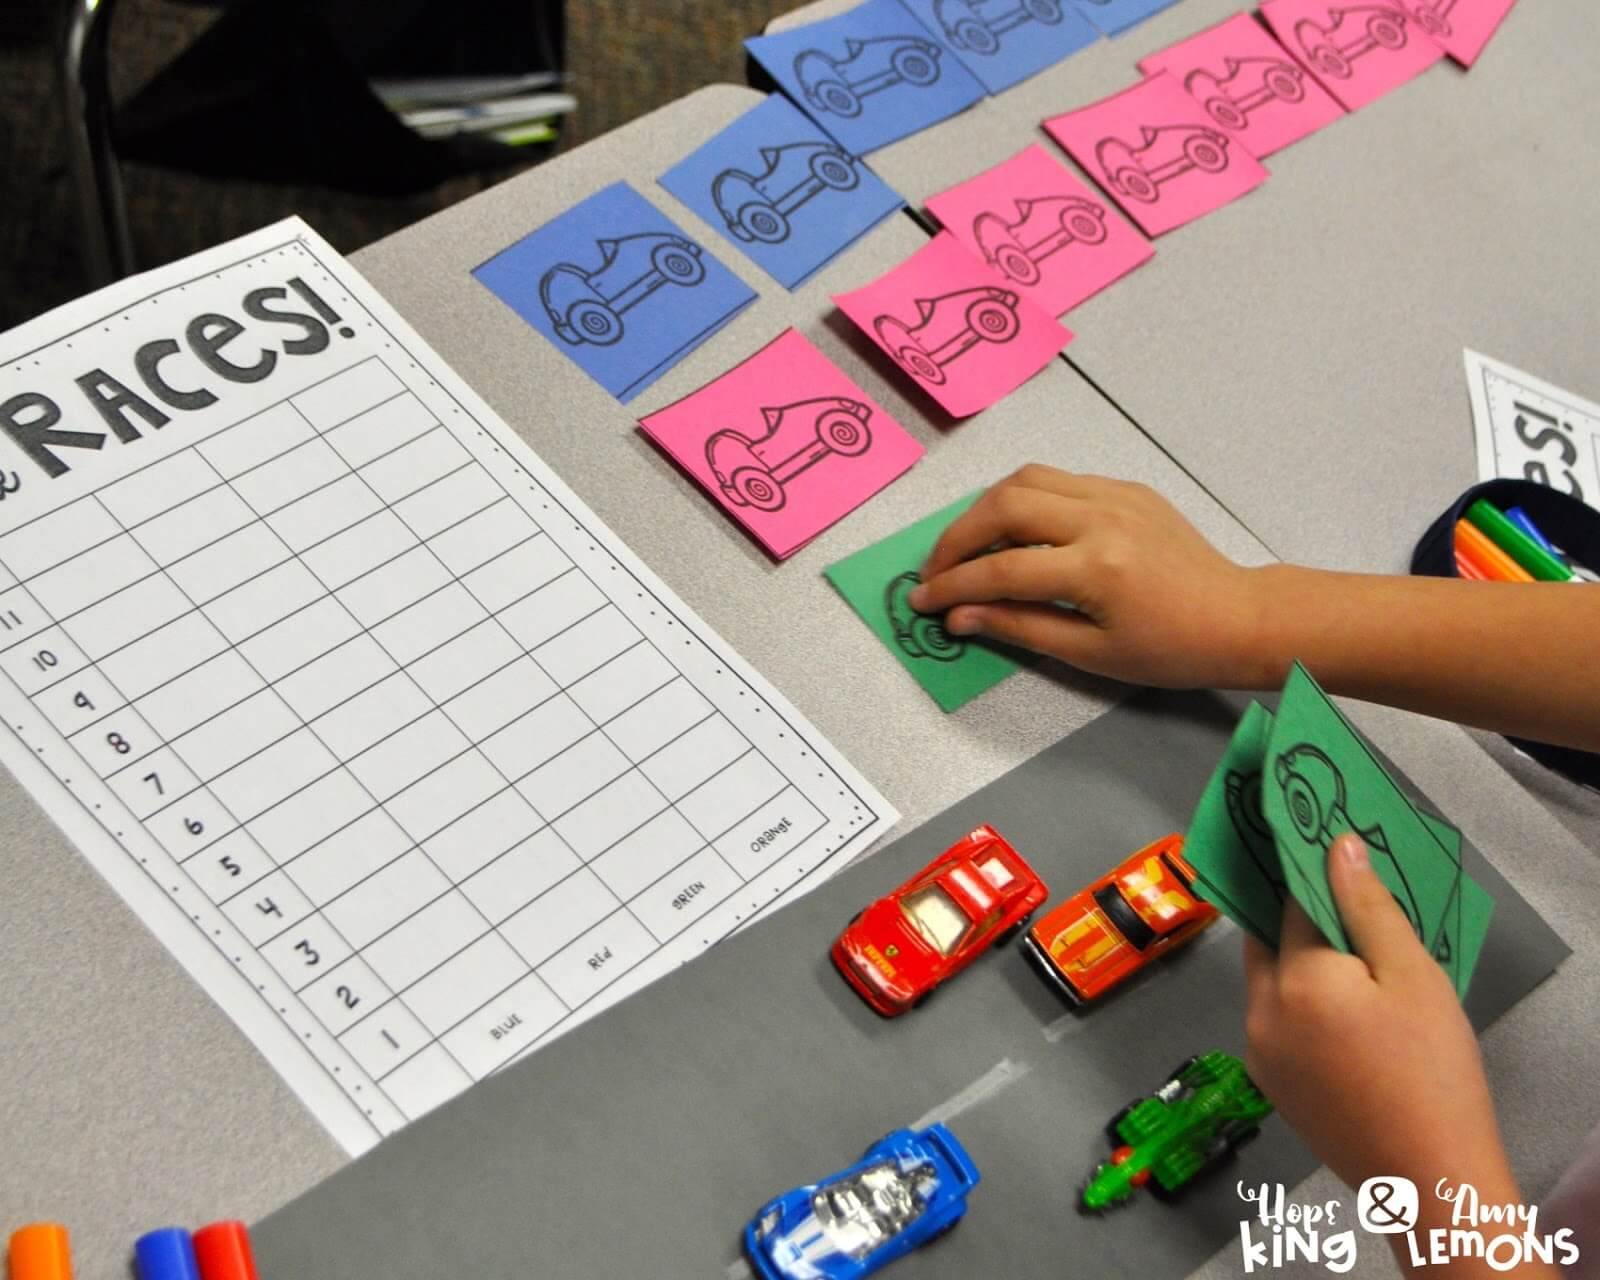
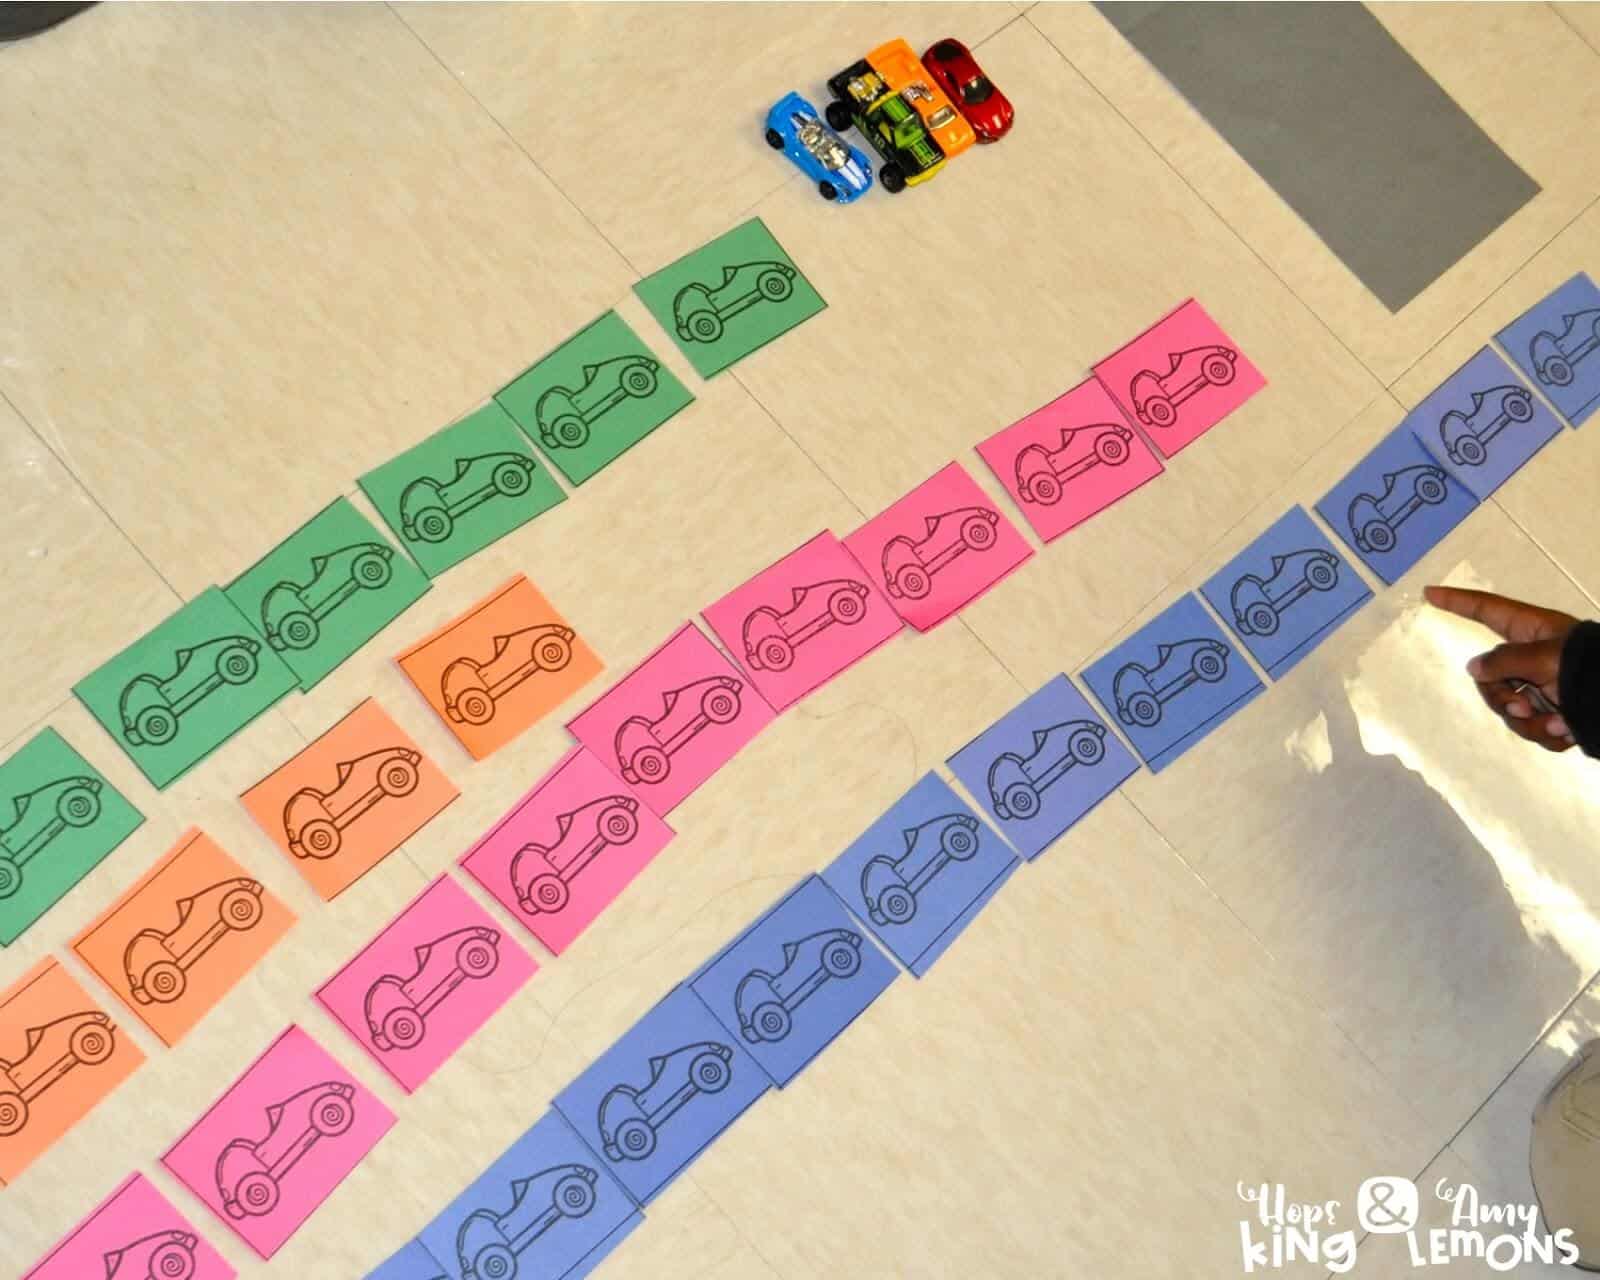
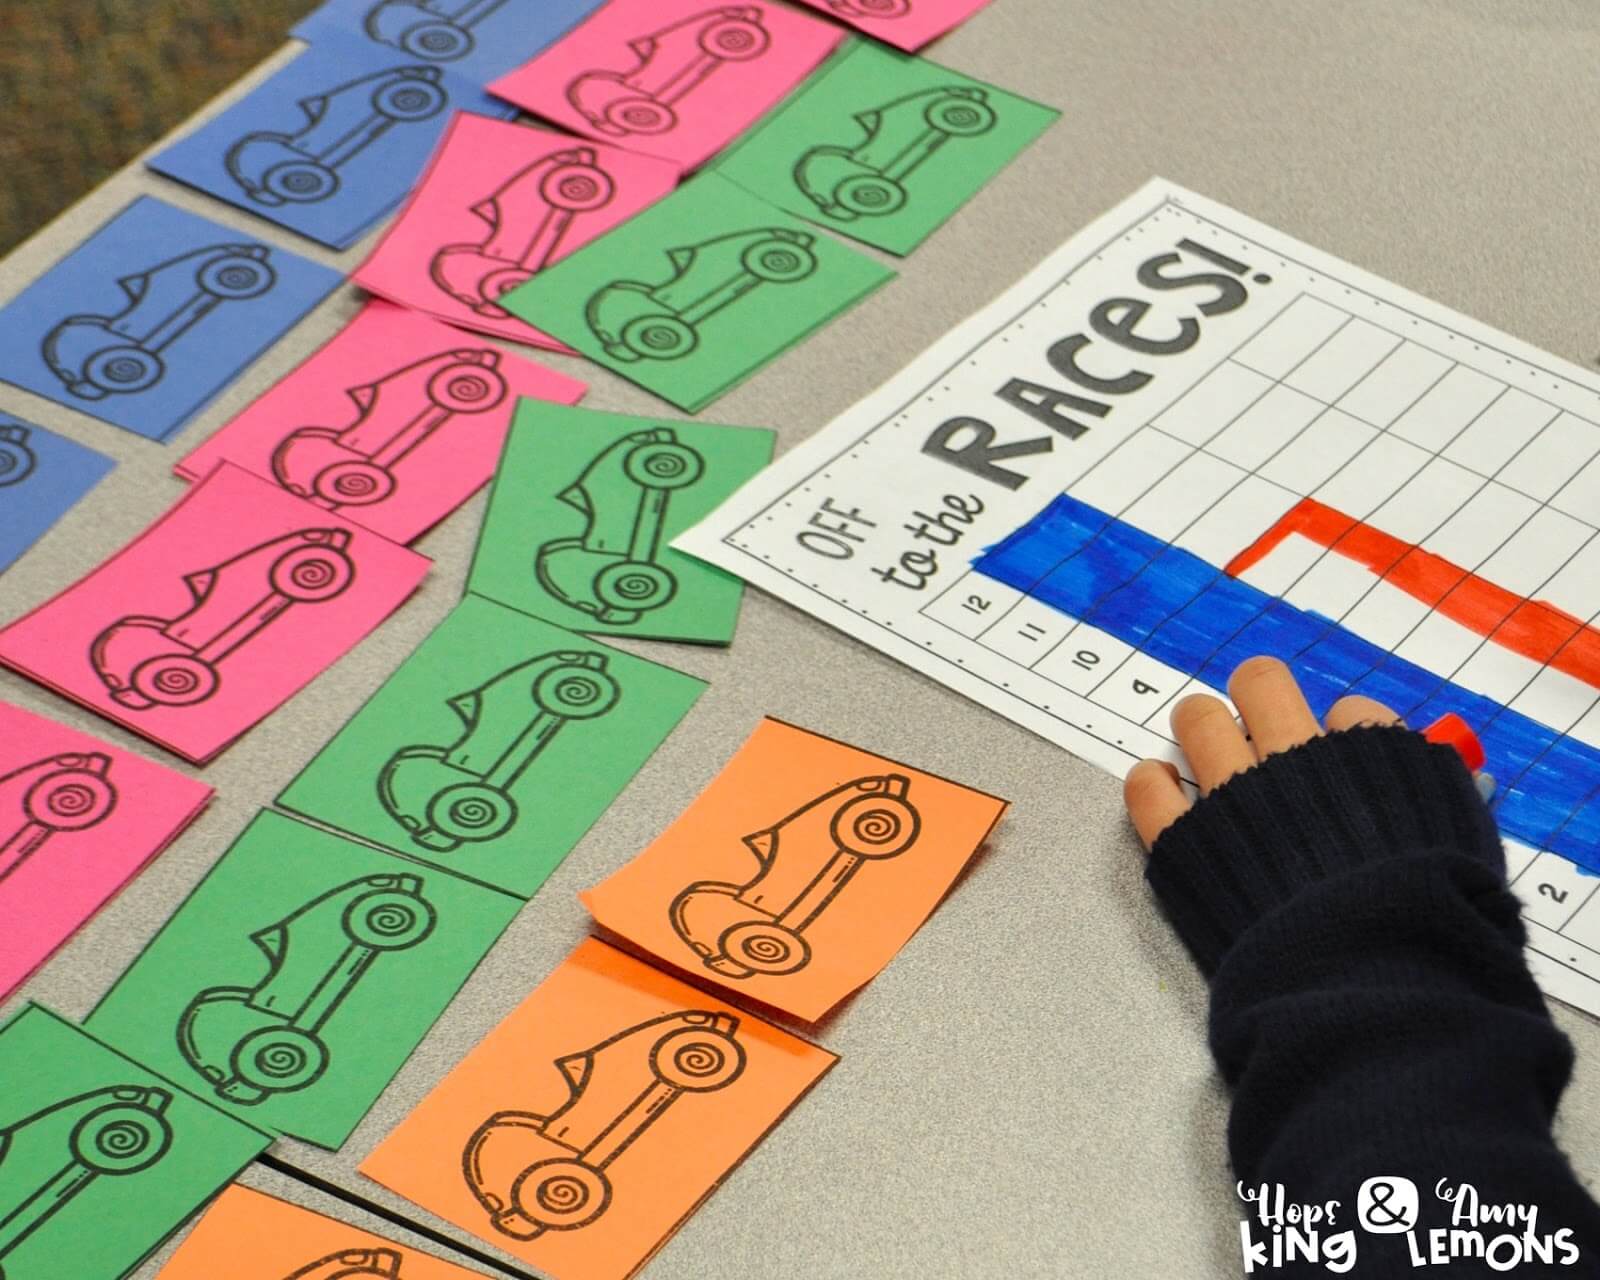
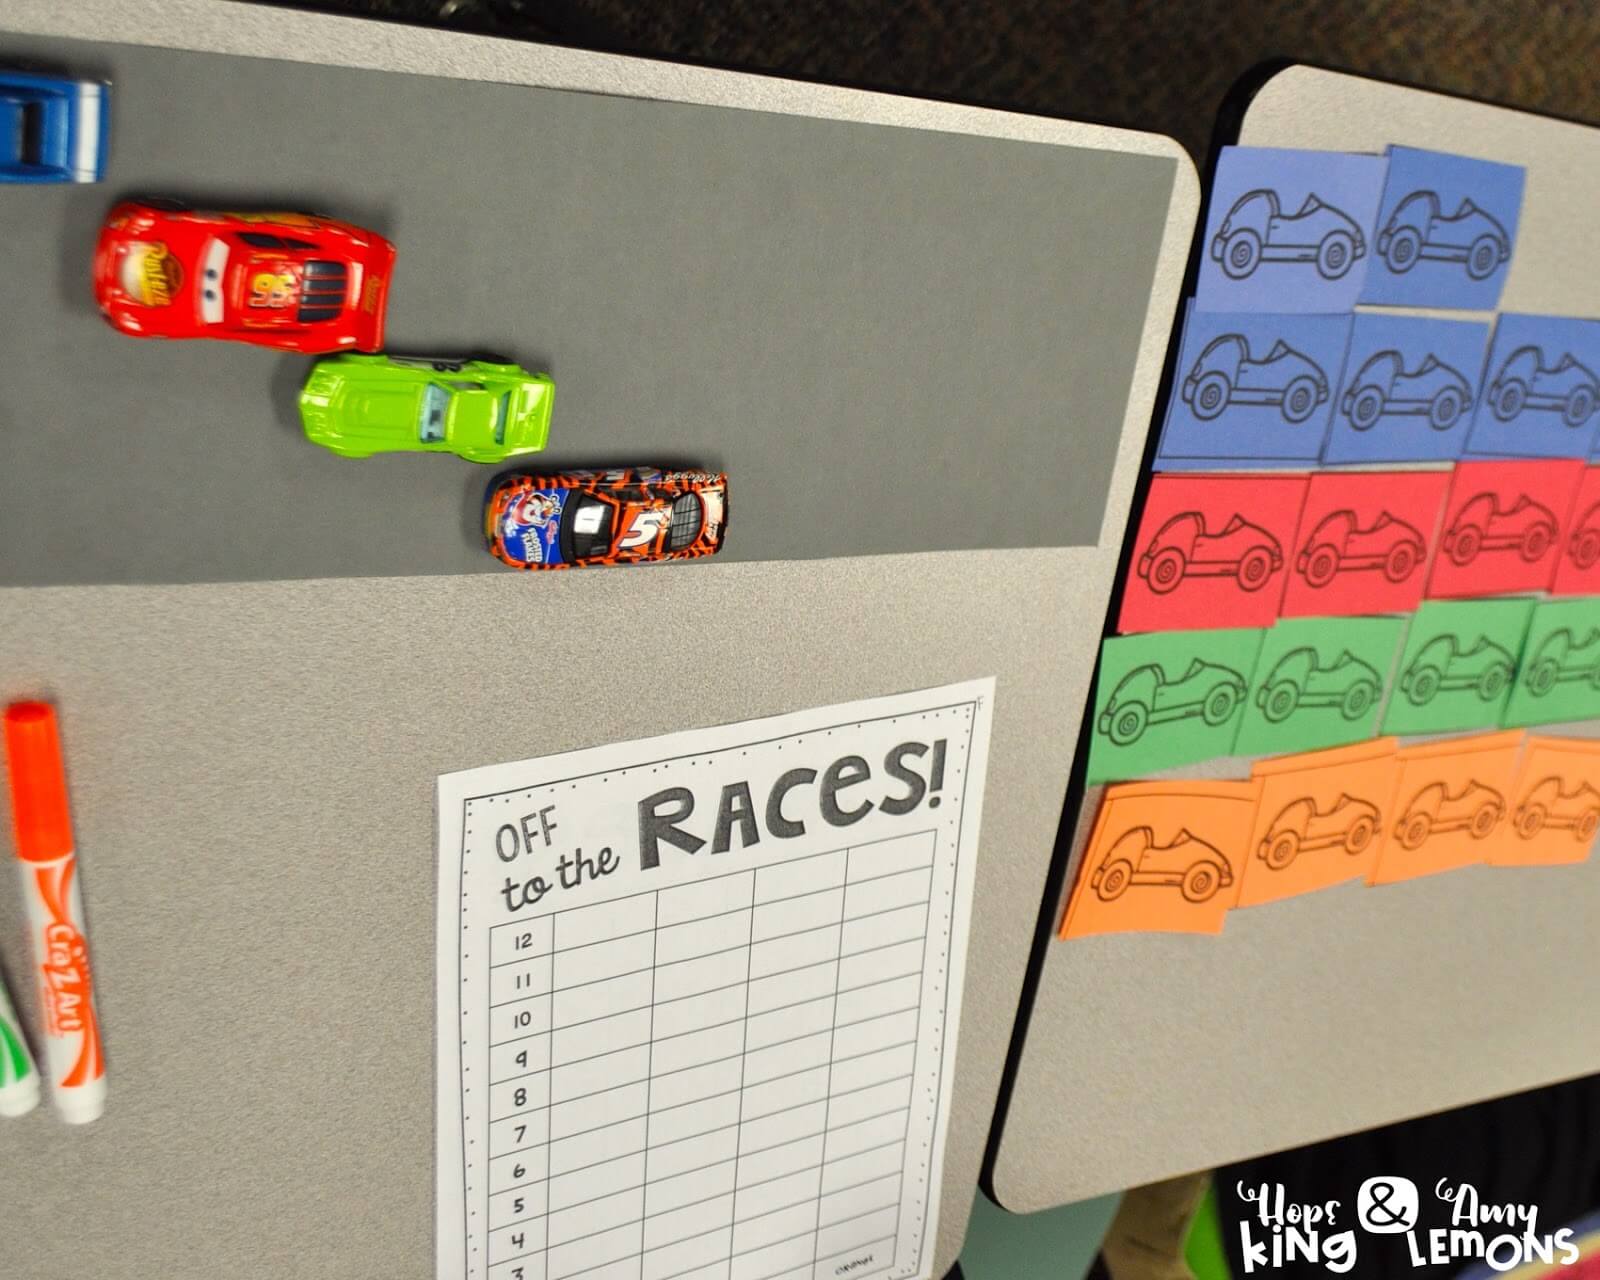
The students then broke into partner groups to see which car was going to win the race. Each group was given a set of data (a collection of colored cars- on cards). I gave each group a blue, red, orange, and green hot wheel car to race throughout their data collecting. As they drew a colored card, they moved the matching car forward along their racetrack (a gray sheet of paper because #lazy).
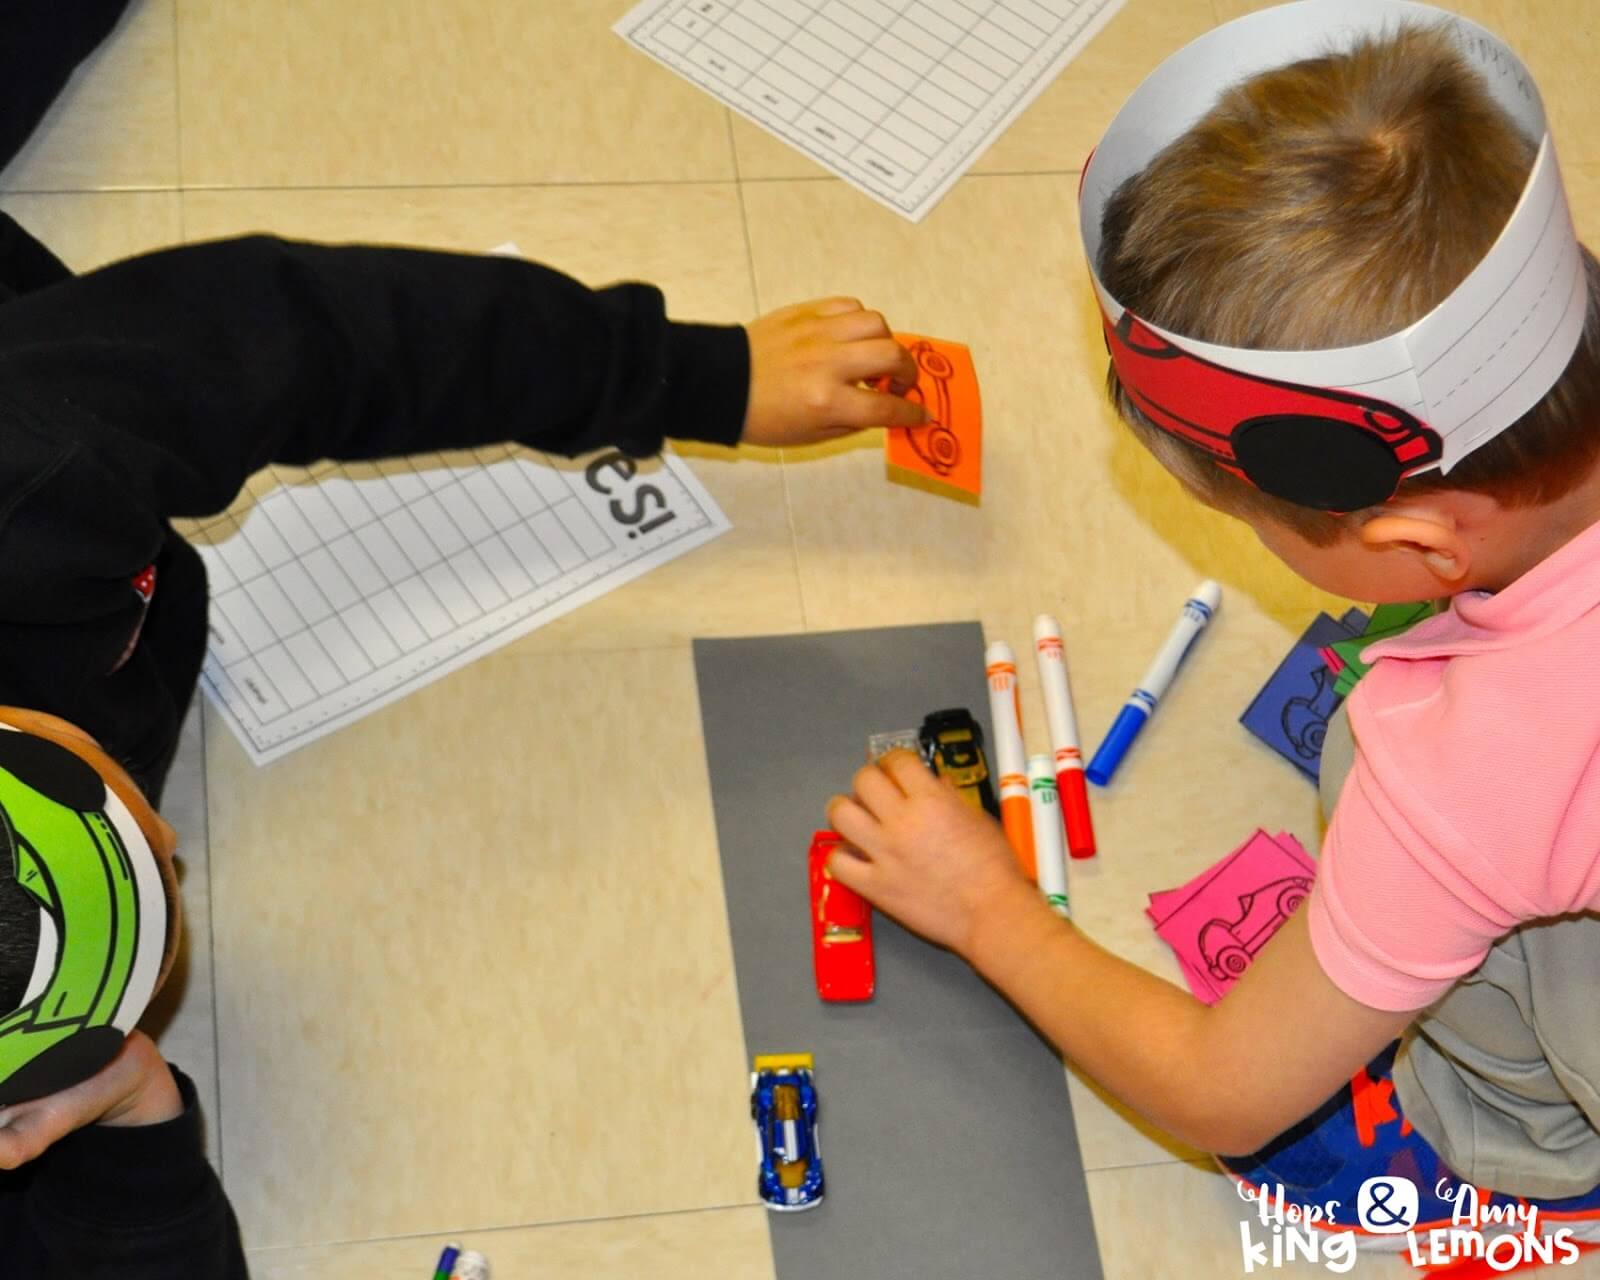
The actual car part of this was all extra. Israel has a gajillion cars, so I just robbed his toy chest before school! The kids really did enjoy moving them along the racetrack though!
Here you can see the students drawing a card and moving that car forward.

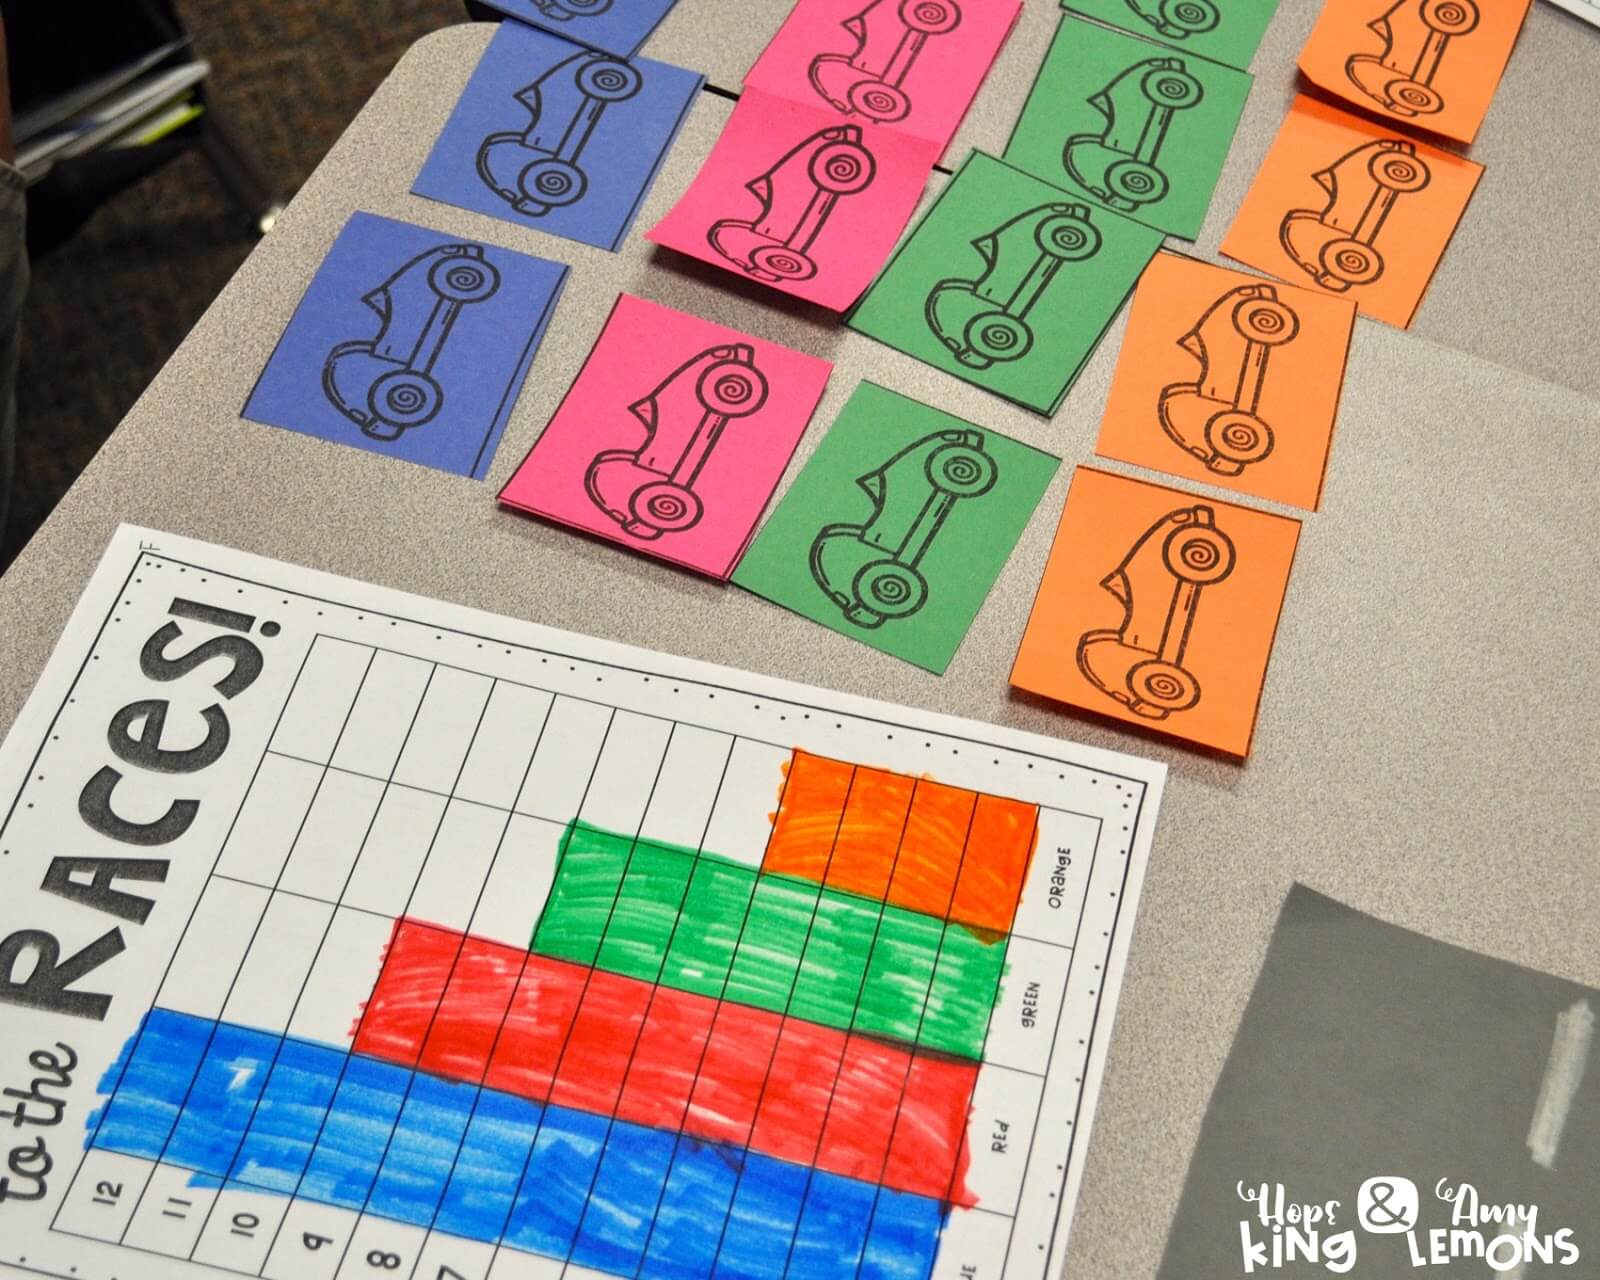
They soon found out that blue was the winner because it had the greatest number of cards in their stack. After completing their race they had to organize their cards into a pictograph.
It was actually pretty neat because when we made our predictions (and they hadn’t seen any data or have a clue yet), the majority of students chose blue and no one chose orange. Blue happened to be our winner and orange was in last place… just like our predictions!
Students turned their pictograph into a bar graph.
After making our pictographs and bar graphs students had to write six statements about their data. I didn’t snap a picture, but they did great with their interpretations. They were putting all of those minilessons and conversations they’ve had over the past two weeks into practice. All of that modeling paid off big time!
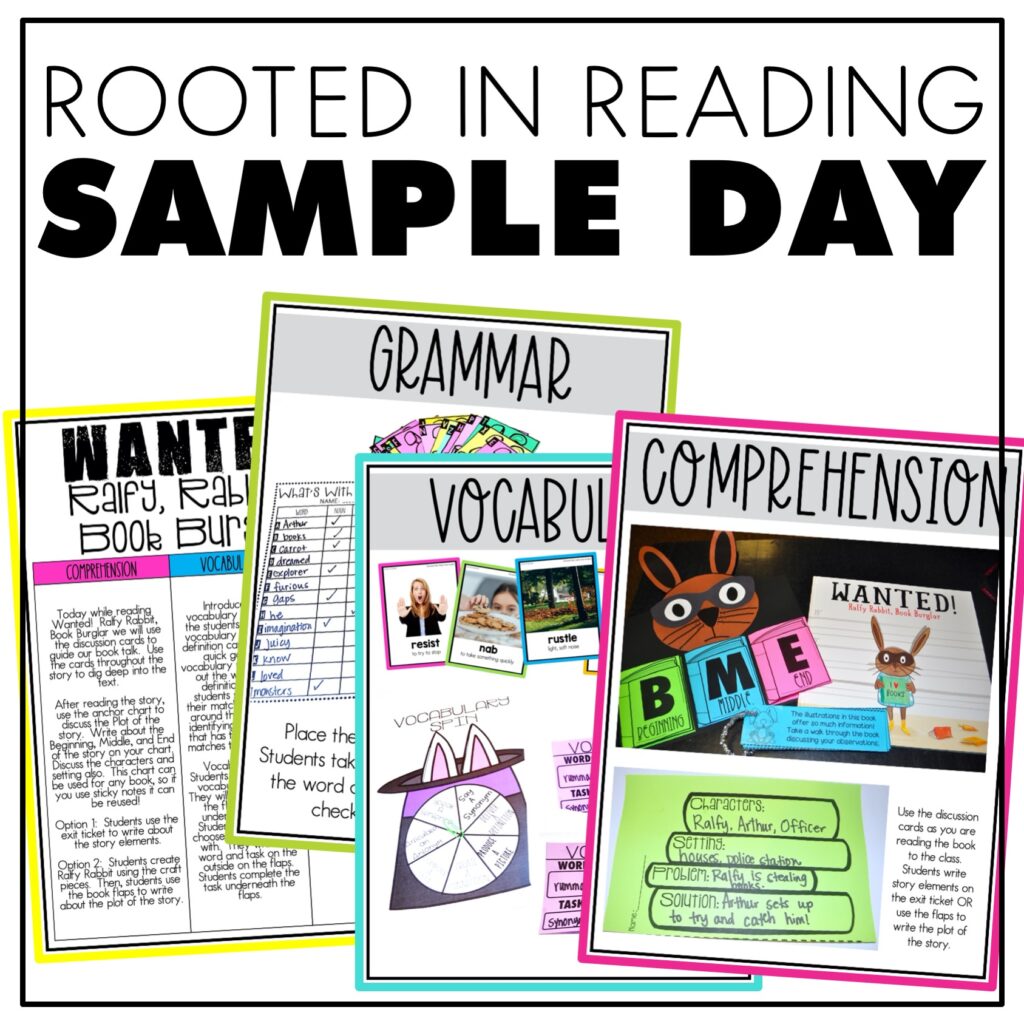
You can find this activity and more by clicking on the image below:
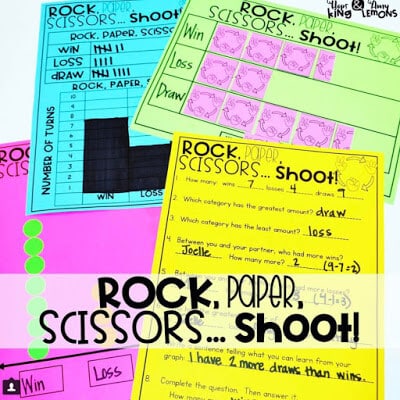
Last week I told you about our new freebie for graphing. I wanted to show you a picture of all it includes! Students can make a bar graph, pictograph, or line plot after playing Rock, Paper, Scissors. There is also a set of questions for students to answer once they have gathered all of their data.
Third Grade teachers, we haven’t left you out! We’ve got lots of fun graphing activities for you also! Click HERE for our collection of bar graph, pictograph, line plot, and frequency table resources and activities!
Have a happy weekend!!


One Response