Here’s the truth. Graphing activities can get boring really fast! Why? Because, oftentimes, students are completing the same type of graphs over and over. “Look at this set of data”, “Answer these questions”, etc. It is time to think beyond show and tell.
Learning how to create and analyze graphs is one of my favorite skills to teach students, so I am passionate about the type of graphing activities I incorporate into my graphing lesson plans. And I think you should be, too.
Many moons ago, I was NOT a math whiz. I struggled a lot as a young student. When I became a teacher, I vowed to always incorporate more fun and engaging ways for students to learn. After a few years of teaching, I finally put those words into action.
So, I’ve learned a thing or two about what makes math lessons engaging or should I say…magical! You can use these 3 strategies to enhance and improve your graphing activities so students are actually interested in participating.
Introducing and Analyzing Graphs

Before I jump into how to enhance your graphing activities, let’s talk about something essential. Many times I’ve found that where we may miss the mark with teaching graphing skills to kids is we don’t show them the why behind it.
Why do we have graphs?
Why do we need them?
How do we get the data?
To begin, you want to introduce what graphs are, what they are used for, and how and why we analyze them. The analysis is often overlooked in graphing discussions with our smallest students, but it is an essential component.
Your students will be much more likely to engage with the lesson if they understand why, right? And we desperately need all the engagement from the little ones we can get, ha!
Use graphing questions to drive the class discussion and start talking about how we use graphs in the real world or how we answer questions using information from the data we collect.
Don’t forget to define and model as you go!
Enhancement Strategies
Once you’ve got a solid grasp on explaining and showing your students how we use graphs, you are ready for some enrichment! Activities help reinforce our lessons, but they shouldn’t be taken for granted.
Graphing activities should be fun. I know “fun” can be a dirty word when we are wanting to just make sure our standards are being met, but trust me, fun belongs there. Fun is simply a motivator and a way to mask the learning so students are active, engaged, and excited about what they are doing in the classroom.
So, the three tips for improving graphing activities I am about to share with you are centered around having fun with your lessons…without skipping on rigorous skill practice.
Graphing Activities that Get Your Students Moving

The single best thing you can do for your students is to allow them to get up from their desks and MOVE! And friend, this does not have to be complicated or intense. In fact, we are definitely going for low intensity here. But the point is, your students get a break from sitting down and writing.
Here are a couple of ways I’ve incorporated this.
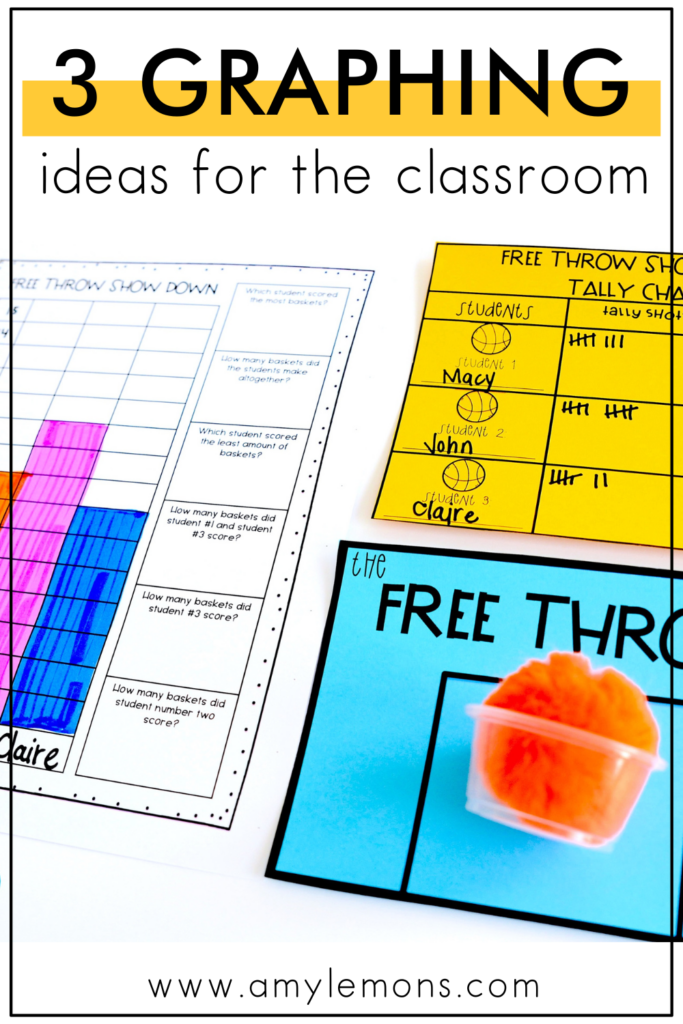
- Students graph the number of baskets they make in a free throw contest
- Students throw poms on a target mat and graph where they land
- Students bowl and graph how many pins they knock down in each round
- Students roll dice across the floor and graph their results
There are so many easy ways to make this work in your classroom with minimal fuss!
Include An Element of Surprise

Piggybacking on the dice graphing idea for movement, there is also an element of surprise for the students! Just imagine their excitement as they eagerly wait for the results of each roll.
Using surprise elements that you wouldn’t normally see in a graphing activity – playing games to collect data or using manipulatives that keep you guessing about the outcomes – is a sure way to get students pumped up for the day’s graphing activities!
Here’s an example of how we use this in the Dice graphing activity:
- Students will roll dice to collect data for their line plot.
- Explain to students that their line plot is numbered 1-6 because it represents the numbers on a die.
- Students roll the dice and mark the number rolled each time with an x.
- You can determine how many rolls you want your students to complete.
- Afterward, students can complete questions based on their line plots and data gathered.
Another surprise element you can try is a game of Rock, Paper, Scissors! Students will have a ball playing this game, but they will really be learning how to collect data. They can graph the results of each round.
You could even try having a little fun with food if your classroom allows it! Graphing with food will always be a hit and you can bet that your students will be pleasantly surprised to see them as part of their lesson.
Graph with High-Interest Topics

Sometimes, all you need to enhance your graphing activities is a high-interest topic or theme! Don’t be afraid to get creative with this.
At the beginning of the year, we try to learn as much as we can about our students and as the year progresses, you should have a solid idea of what many of their common interests are.
And there are some interests that are just universal among kids…like pizza! If it interests the students, it will keep their attention.
Bonus points if you can add a craft or drawing to help them visualize the lesson and get hands-on with learning.
Here’s an example of how I’ve done this with pizza:
- The students will survey the class to find the class’ favorite pizza.
- Begin by allowing students to quickly cast their vote by making a slice of pizza craft or drawing that represents their vote (Example: a. Cheese Only, b. Pepperoni, c. Sausage, d. Supreme)
- Display these around the classroom (students can just simply lay them on their desks.)
- The students will then rotate around to each pizza to gather the class’ data on a tally chart.
- Then, they will graph the results.
- Lastly, they can return to the carpet to discuss the graphs created by using question stem cards.
Incorporating high-interest topics is an easy way to drive engagement. Here are some other high-interest topics you could consider:
- Race cars
- Favorite games
- Sports
- Favorite colors
- Favorite characters
- Family and Friends
The options are endless!
When you’re equipped with graphing activities that go beyond the show and tell, plus include elements of fun, you’ll find that teaching students how to graph becomes a lot more enjoyable for both you and your students.
Don’t want to forget these tips for improving your graphing activities in the classroom? Save the image below!